
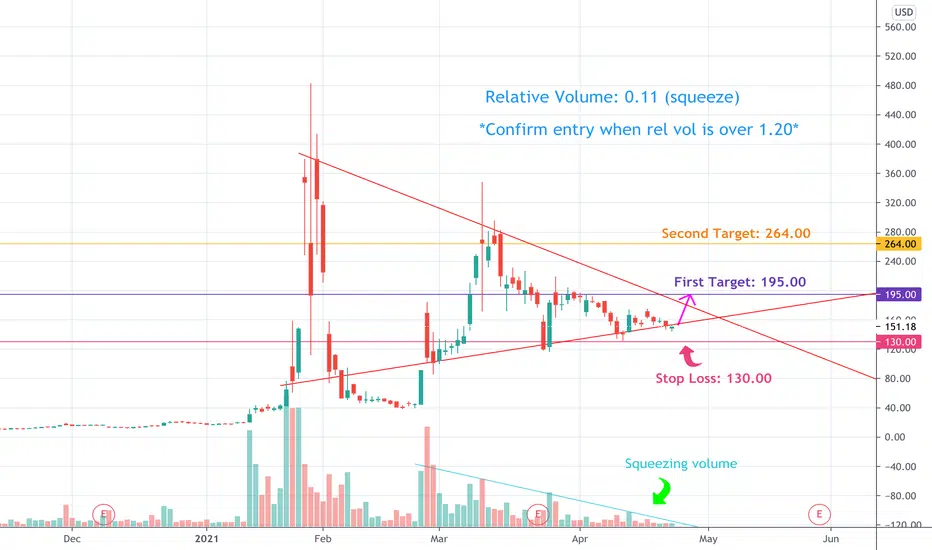
Regardless of GME being a meme stock, we are seeing a solid symmetrical pattern on the daily chart. Relative volume confirms a squeeze in GME, it trading only 11% of volume last trading day compared to its average.
For entry, wait on rel vol to increase (Would like to see ~1.20), a bounce off support ~150.00, and Breakout on volume (Bottom of chart).
First Target: 195.00
Second Target: 264.00
Stop Loss: 130.00
Anxious to see this ticker moon once again.
For entry, wait on rel vol to increase (Would like to see ~1.20), a bounce off support ~150.00, and Breakout on volume (Bottom of chart).
First Target: 195.00
Second Target: 264.00
Stop Loss: 130.00
Anxious to see this ticker moon once again.

Clause de non-responsabilité
Les informations et publications ne sont pas destinées à être, et ne constituent pas, des conseils ou recommandations financiers, d'investissement, de trading ou autres fournis ou approuvés par TradingView. Pour en savoir plus, consultez les Conditions d'utilisation.
Clause de non-responsabilité
Les informations et publications ne sont pas destinées à être, et ne constituent pas, des conseils ou recommandations financiers, d'investissement, de trading ou autres fournis ou approuvés par TradingView. Pour en savoir plus, consultez les Conditions d'utilisation.