
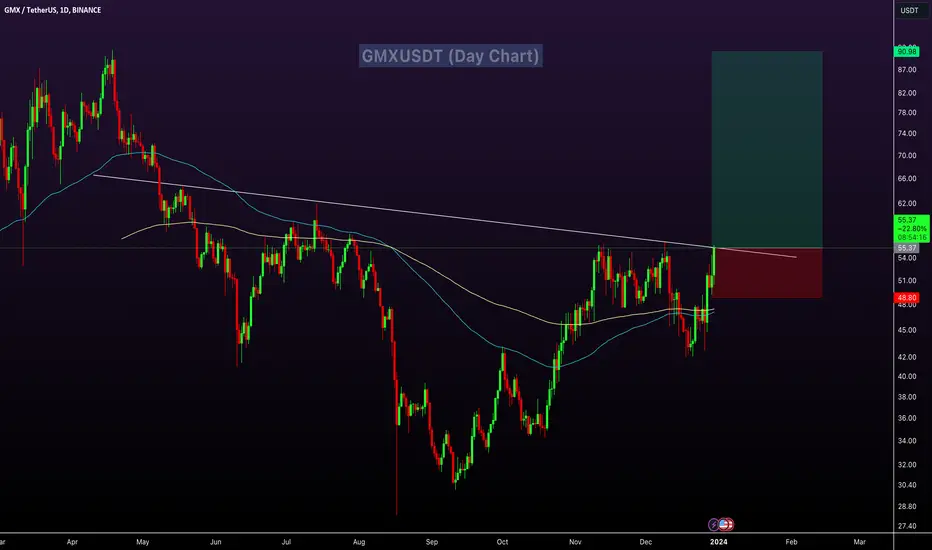
GMXUSDT Technical analysis update
GMXUSDT has formed an inverse head and shoulder pattern on the daily chart. With the price breaking its neckline, this suggests a potential bullish signal for GMX.
Buy zone: Below $55.50
Stop loss : $48.75
Take Profit 1: $60.50
Take Profit 2: $72.00
Take Profit 3: $90.00
Thanks
Hexa
GMXUSDT has formed an inverse head and shoulder pattern on the daily chart. With the price breaking its neckline, this suggests a potential bullish signal for GMX.
Buy zone: Below $55.50
Stop loss : $48.75
Take Profit 1: $60.50
Take Profit 2: $72.00
Take Profit 3: $90.00
Thanks
Hexa

🚀Telegram : t.me/hexatrades
🌐Website: hexatrades.io/
🗣️Twitter(X): twitter.com/HexaTrades
🌐Website: hexatrades.io/
🗣️Twitter(X): twitter.com/HexaTrades
Publications connexes
Clause de non-responsabilité
Les informations et publications ne sont pas destinées à être, et ne constituent pas, des conseils ou recommandations financiers, d'investissement, de trading ou autres fournis ou approuvés par TradingView. Pour en savoir plus, consultez les Conditions d'utilisation.
🚀Telegram : t.me/hexatrades
🌐Website: hexatrades.io/
🗣️Twitter(X): twitter.com/HexaTrades
🌐Website: hexatrades.io/
🗣️Twitter(X): twitter.com/HexaTrades
Publications connexes
Clause de non-responsabilité
Les informations et publications ne sont pas destinées à être, et ne constituent pas, des conseils ou recommandations financiers, d'investissement, de trading ou autres fournis ou approuvés par TradingView. Pour en savoir plus, consultez les Conditions d'utilisation.