
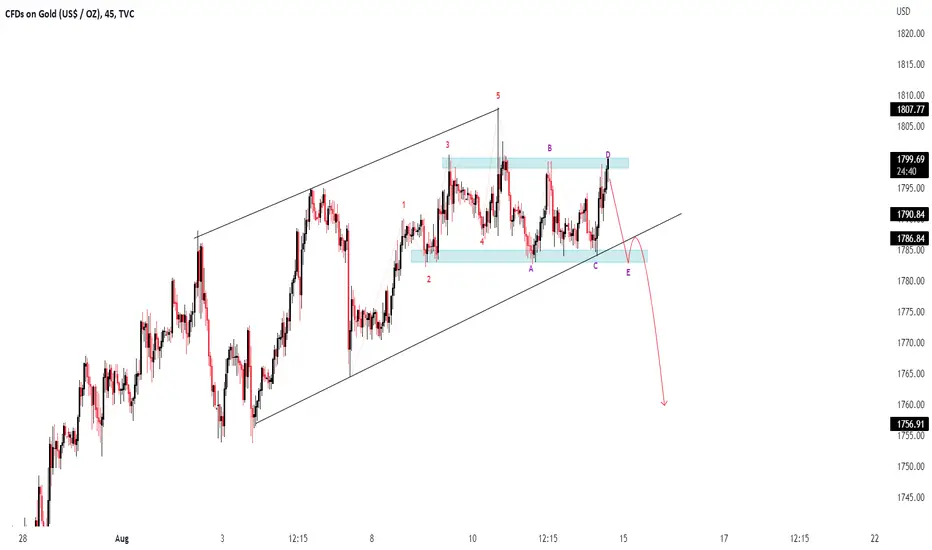
XAU/USD ( Gold / U.S Dollar ) Technical Analysis Chart Update
Time Frame - M45
According to the Pattern in Short Time Frame #STF ( #Bullish Channel ) it failed to Break the Strong Resistance Level #1798-9
According to Elliot waves it has completed the Impulsive #12345 waves and its now Following Corrective wave #ABCDE it will follow Sell Trend to complete its " E " wave
If it Breaks the Lower Trend Line #LTL and Retest it will follow More Sell

Clause de non-responsabilité
Les informations et publications ne sont pas destinées à être, et ne constituent pas, des conseils ou recommandations financiers, d'investissement, de trading ou autres fournis ou approuvés par TradingView. Pour en savoir plus, consultez les Conditions d'utilisation.
Clause de non-responsabilité
Les informations et publications ne sont pas destinées à être, et ne constituent pas, des conseils ou recommandations financiers, d'investissement, de trading ou autres fournis ou approuvés par TradingView. Pour en savoir plus, consultez les Conditions d'utilisation.