
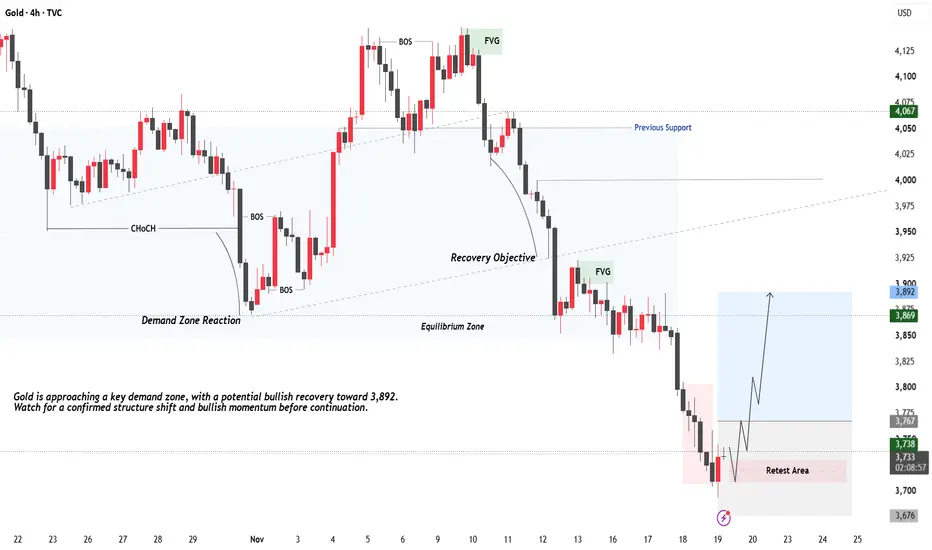
GOLD (XAUUSD) – 4H DEMAND ZONE REACTION & POTENTIAL BULLISH RECOVERY
Gold is approaching a technically important demand area following the recent bearish move. The current chart highlights key structural levels, potential price reactions, and an alternative bullish recovery scenario. The main focus is to observe whether buyers can establish control and drive price toward the projected upside levels.
Step-by-Step Technical Breakdown
1. Current Market Structure
Gold has experienced notable bearish pressure. Price action around the highlighted support area will be important in determining whether the market continues lower or begins a corrective recovery.
2. Major Demand Zone
The middle long rectangle identifies an important demand and support region. This area deserves close attention because a strong buying response could create the foundation for a potential bullish recovery.
3. FVG – Fair Value Gap
The marked Fair Value Gap represents an imbalance area that price may revisit. Monitor how price reacts around this region for potential rejection or continuation signals.
4. Key Structural Resistance
The horizontal line beneath the FVG marks an important structural level. A successful reclaim and sustained move above this level could strengthen the bullish recovery scenario.
5. Projected Bullish Recovery Path
The left curved projection illustrates a possible upside recovery from the demand region. This scenario depends on buyers demonstrating strength and establishing a bullish market structure shift.
6. Upside Projection – 3,892
The right-side projected area represents the potential recovery objective. Price may attempt to move toward this region if bullish momentum develops and intermediate resistance levels are successfully reclaimed.
7. Confirmation Before Entry
Watch for:
- Strong bullish rejection from demand.
- Higher highs and higher lows.
- A confirmed bullish break of structure.
- Strong bullish candle closes.
- Successful resistance retests.
These signals can help distinguish a genuine recovery from a temporary pullback.
8. Risk Management
Avoid anticipating the projected move without confirmation. Define invalidation levels, maintain appropriate position sizing, and protect capital throughout the trade.
FINAL MARKET OUTLOOK
The chart presents a potential bullish recovery scenario from a key demand region, with 3,892 identified as the projected upside objective. The critical factor is whether buyers can defend support, reclaim structural resistance, and establish sustainable bullish momentum.
Patience. Precision. Discipline. Consistency.
Gold is approaching a technically important demand area following the recent bearish move. The current chart highlights key structural levels, potential price reactions, and an alternative bullish recovery scenario. The main focus is to observe whether buyers can establish control and drive price toward the projected upside levels.
Step-by-Step Technical Breakdown
1. Current Market Structure
Gold has experienced notable bearish pressure. Price action around the highlighted support area will be important in determining whether the market continues lower or begins a corrective recovery.
2. Major Demand Zone
The middle long rectangle identifies an important demand and support region. This area deserves close attention because a strong buying response could create the foundation for a potential bullish recovery.
3. FVG – Fair Value Gap
The marked Fair Value Gap represents an imbalance area that price may revisit. Monitor how price reacts around this region for potential rejection or continuation signals.
4. Key Structural Resistance
The horizontal line beneath the FVG marks an important structural level. A successful reclaim and sustained move above this level could strengthen the bullish recovery scenario.
5. Projected Bullish Recovery Path
The left curved projection illustrates a possible upside recovery from the demand region. This scenario depends on buyers demonstrating strength and establishing a bullish market structure shift.
6. Upside Projection – 3,892
The right-side projected area represents the potential recovery objective. Price may attempt to move toward this region if bullish momentum develops and intermediate resistance levels are successfully reclaimed.
7. Confirmation Before Entry
Watch for:
- Strong bullish rejection from demand.
- Higher highs and higher lows.
- A confirmed bullish break of structure.
- Strong bullish candle closes.
- Successful resistance retests.
These signals can help distinguish a genuine recovery from a temporary pullback.
8. Risk Management
Avoid anticipating the projected move without confirmation. Define invalidation levels, maintain appropriate position sizing, and protect capital throughout the trade.
FINAL MARKET OUTLOOK
The chart presents a potential bullish recovery scenario from a key demand region, with 3,892 identified as the projected upside objective. The critical factor is whether buyers can defend support, reclaim structural resistance, and establish sustainable bullish momentum.
Patience. Precision. Discipline. Consistency.
Note
🔴 GOLD (XAUUSD) – MARKET ACTIVE The market is active, and price action is being monitored around the key demand zone, FVG, and structural resistance.
The potential bullish recovery toward 3,892 remains in focus, subject to buyer confirmation and a bullish break of structure.
Stay alert for the next market development. Maintain disciplined risk management.
Transaction en cours
Trade Active – Bullish Reversal or Further Bearish Continuation?
The market is currently showing strong bearish momentum following a sharp downside move. However, the current price area could become a potential reversal zone. If buyers manage to push the price above the nearby resistance and establish a strong bullish structure, it could signal the beginning of an uptrend. Until that confirmation appears, sellers remain in control, and further downside pressure is possible.
Key Focus: A confirmed break above resistance could shift market sentiment bullish; otherwise, bearish momentum may continue with increased selling pressure. Patience and price-action confirmation are essential before taking a position.

Elite Gold Concept
XAUUSD • Smart Money Concepts (SMC) • Price Action
Educational purposes only. Not financial advice.
Telegram: t.me/+wy30_n0As2FjZTY0
XAUUSD • Smart Money Concepts (SMC) • Price Action
Educational purposes only. Not financial advice.
Telegram: t.me/+wy30_n0As2FjZTY0
Publications connexes
Clause de non-responsabilité
Les informations et publications ne sont pas destinées à être, et ne constituent pas, des conseils ou recommandations financiers, d'investissement, de trading ou autres fournis ou approuvés par TradingView. Pour en savoir plus, consultez les Conditions d'utilisation.
Elite Gold Concept
XAUUSD • Smart Money Concepts (SMC) • Price Action
Educational purposes only. Not financial advice.
Telegram: t.me/+wy30_n0As2FjZTY0
XAUUSD • Smart Money Concepts (SMC) • Price Action
Educational purposes only. Not financial advice.
Telegram: t.me/+wy30_n0As2FjZTY0
Publications connexes
Clause de non-responsabilité
Les informations et publications ne sont pas destinées à être, et ne constituent pas, des conseils ou recommandations financiers, d'investissement, de trading ou autres fournis ou approuvés par TradingView. Pour en savoir plus, consultez les Conditions d'utilisation.