
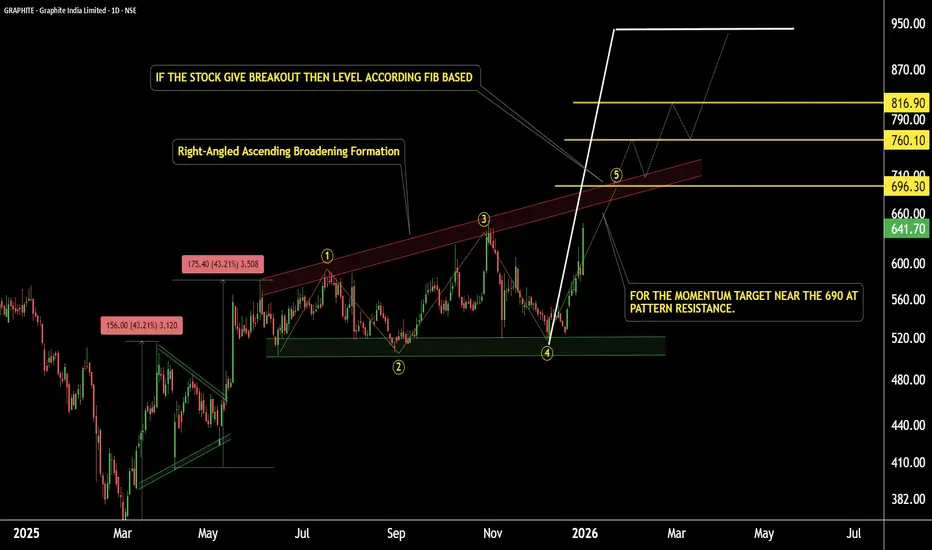
Graphite India – Daily Timeframe Technical View
This is the daily timeframe chart of Graphite India.
The stock has formed a Right-Angled Ascending Broadening Formation, with a strong support zone near 500–520. The broadening structure appears to have completed a five-wave formation, while the key resistance zone is placed near 690–700.
A decisive breakout above the resistance zone, preferably with volume confirmation, could trigger a strong upside move. Based on Fibonacci projections, the final pattern target is placed near 940.
As long as the stock continues to hold above its key support zones, the ongoing rally is likely to continue, keeping the broader trend positive.
Thank you.
This is the daily timeframe chart of Graphite India.
The stock has formed a Right-Angled Ascending Broadening Formation, with a strong support zone near 500–520. The broadening structure appears to have completed a five-wave formation, while the key resistance zone is placed near 690–700.
A decisive breakout above the resistance zone, preferably with volume confirmation, could trigger a strong upside move. Based on Fibonacci projections, the final pattern target is placed near 940.
As long as the stock continues to hold above its key support zones, the ongoing rally is likely to continue, keeping the broader trend positive.
Thank you.

@RahulSarawagi
Connect us at optionlab.co.in/
Connect us at optionlab.co.in/
Clause de non-responsabilité
Les informations et publications ne sont pas destinées à être, et ne constituent pas, des conseils ou recommandations financiers, d'investissement, de trading ou autres fournis ou approuvés par TradingView. Pour en savoir plus, consultez les Conditions d'utilisation.
@RahulSarawagi
Connect us at optionlab.co.in/
Connect us at optionlab.co.in/
Clause de non-responsabilité
Les informations et publications ne sont pas destinées à être, et ne constituent pas, des conseils ou recommandations financiers, d'investissement, de trading ou autres fournis ou approuvés par TradingView. Pour en savoir plus, consultez les Conditions d'utilisation.