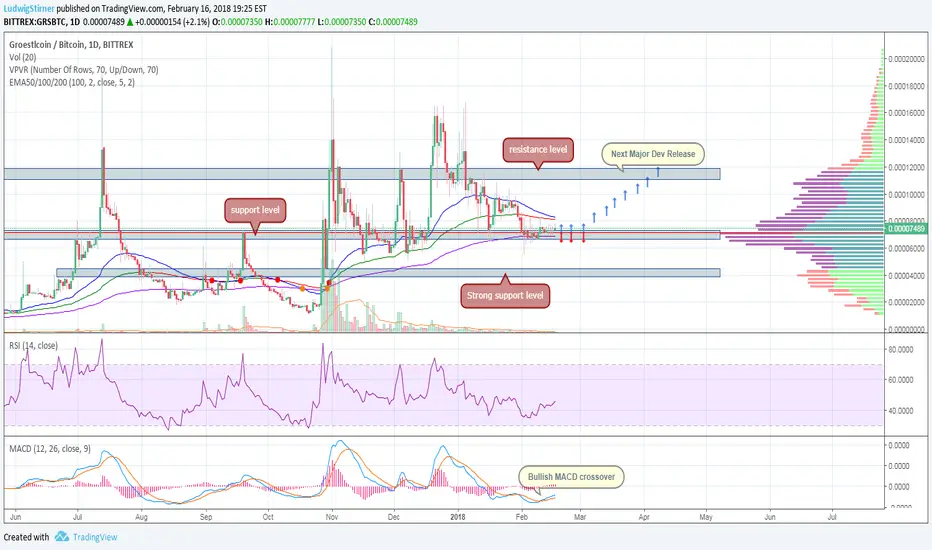
Moreover, the downside pressure seems to be weakening, while the technical indicators are endorsing the bullish scenario. From the technical point of view, in the short-term timeframe, the MACD indicator is approaching the positive bullish crossover, while the RSI is moving slightly higher above the oversold zone. Also, the price has just hit the 200-Day EMA near 6k Sats.
Further gains could see the resistance barrier, which overlaps with the 50-Day and 100-Day EMA. A jump above the aforementioned obstacle could reinforce the bullish structure in the short-term and open the way towards the next key resistance at 10k Sats.
Further gains could see the resistance barrier, which overlaps with the 50-Day and 100-Day EMA. A jump above the aforementioned obstacle could reinforce the bullish structure in the short-term and open the way towards the next key resistance at 10k Sats.

Clause de non-responsabilité
Les informations et publications ne sont pas destinées à être, et ne constituent pas, des conseils ou recommandations financiers, d'investissement, de trading ou autres fournis ou approuvés par TradingView. Pour en savoir plus, consultez les Conditions d'utilisation.
Clause de non-responsabilité
Les informations et publications ne sont pas destinées à être, et ne constituent pas, des conseils ou recommandations financiers, d'investissement, de trading ou autres fournis ou approuvés par TradingView. Pour en savoir plus, consultez les Conditions d'utilisation.