
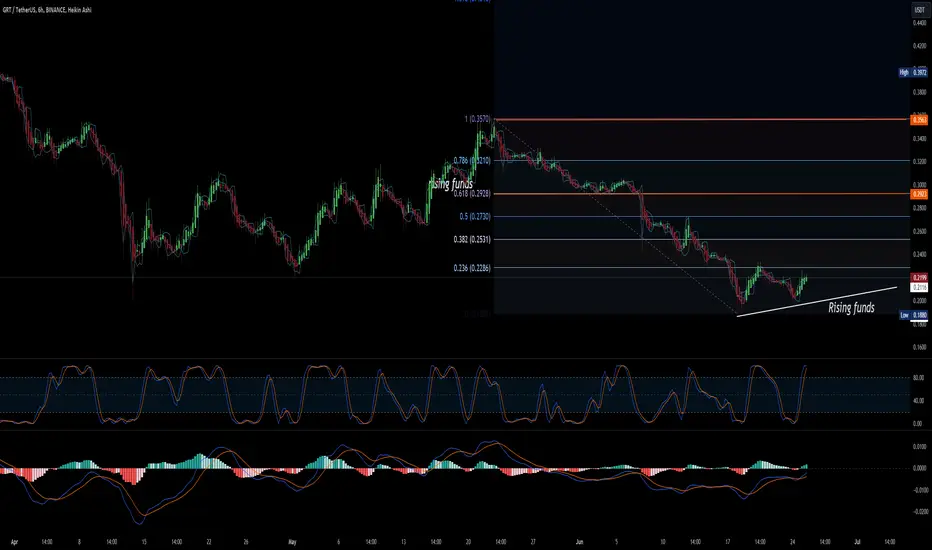
With rising bottoms, GRT rewrites a new graphic pattern, deconstructing the figure of the descending channel
Pattern: The price is approaching resistance, which is a level where it could pause or reverse its recent advance, at least temporarily. Resistance is at 0. Once the price breaks above the resistance, it may move towards the next resistance level at 0.2529. its support zones are: 0.1963 and 0.1875
The short-term trend is bullish.
Pattern: The price is approaching resistance, which is a level where it could pause or reverse its recent advance, at least temporarily. Resistance is at 0. Once the price breaks above the resistance, it may move towards the next resistance level at 0.2529. its support zones are: 0.1963 and 0.1875
The short-term trend is bullish.

Renato Ulianov | Market Analysis & Trading
YouTube: youtube.com/@TradewithRenatoUlianov
Disclaimer: All content is for educational and informational purposes only and does not constitute financial advice.
YouTube: youtube.com/@TradewithRenatoUlianov
Disclaimer: All content is for educational and informational purposes only and does not constitute financial advice.
Clause de non-responsabilité
Les informations et publications ne sont pas destinées à être, et ne constituent pas, des conseils ou recommandations financiers, d'investissement, de trading ou autres fournis ou approuvés par TradingView. Pour en savoir plus, consultez les Conditions d'utilisation.
Renato Ulianov | Market Analysis & Trading
YouTube: youtube.com/@TradewithRenatoUlianov
Disclaimer: All content is for educational and informational purposes only and does not constitute financial advice.
YouTube: youtube.com/@TradewithRenatoUlianov
Disclaimer: All content is for educational and informational purposes only and does not constitute financial advice.
Clause de non-responsabilité
Les informations et publications ne sont pas destinées à être, et ne constituent pas, des conseils ou recommandations financiers, d'investissement, de trading ou autres fournis ou approuvés par TradingView. Pour en savoir plus, consultez les Conditions d'utilisation.