
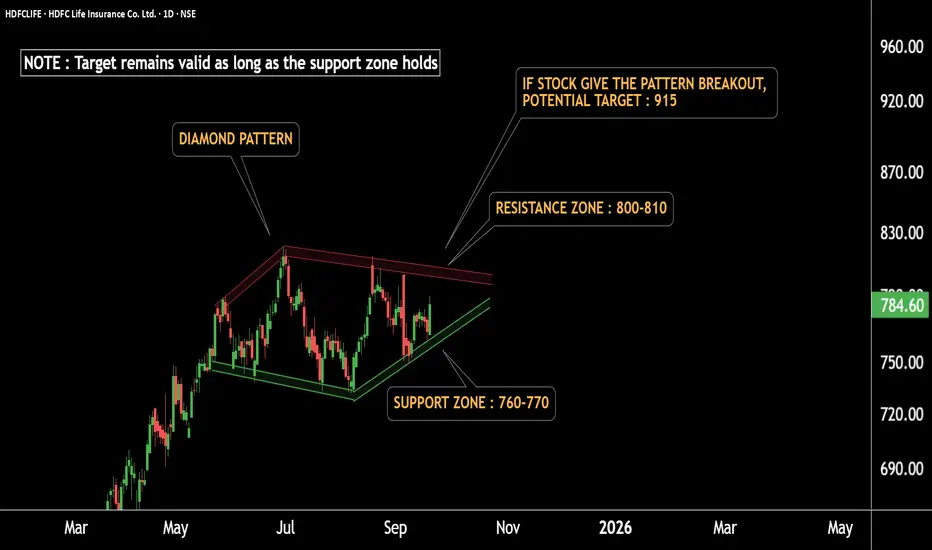
This is the daily timeframe chart of HDFC Life Insurance.
The stock is currently forming a Diamond Pattern with a support zone around 760–770.
In the short term, the price action indicates a potential move toward the pattern resistance zone at 800–810.
A confirmed breakout above this level could unlock a larger upside, with a pattern target projected near 915.
Thank you
The stock is currently forming a Diamond Pattern with a support zone around 760–770.
In the short term, the price action indicates a potential move toward the pattern resistance zone at 800–810.
A confirmed breakout above this level could unlock a larger upside, with a pattern target projected near 915.
Thank you

@RahulSarawagi
Connect us at optionlab.co.in/
Connect us at optionlab.co.in/
Clause de non-responsabilité
Les informations et publications ne sont pas destinées à être, et ne constituent pas, des conseils ou recommandations financiers, d'investissement, de trading ou autres fournis ou approuvés par TradingView. Pour en savoir plus, consultez les Conditions d'utilisation.
@RahulSarawagi
Connect us at optionlab.co.in/
Connect us at optionlab.co.in/
Clause de non-responsabilité
Les informations et publications ne sont pas destinées à être, et ne constituent pas, des conseils ou recommandations financiers, d'investissement, de trading ou autres fournis ou approuvés par TradingView. Pour en savoir plus, consultez les Conditions d'utilisation.