
Technical:
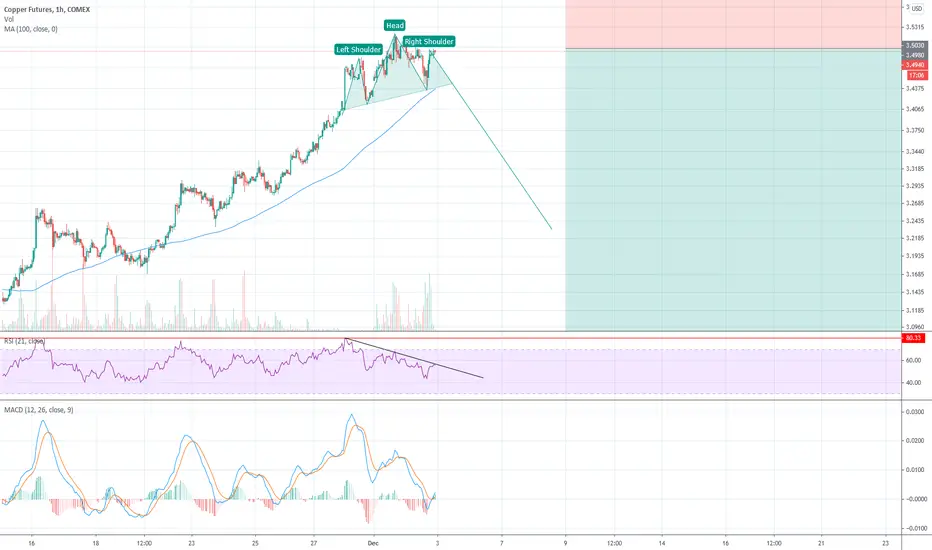
An hour precision chart indicates possible head and shoulder formation, negative RSI. Day precision chart indicates RSI almost at its 80s and if a divergence is to be build somewhere there is a high chance it is here.
Fundamental:
Low stockpile of copper in China has inspired a rally but at this level of stockpile ALWAYS in the past we have seen a move that rebuilds it fast within a month.
Take profit 2.5
It would be great to see gold retest 1850 from bottom and then all commodities could initiate a simultaneous correction. In the long term commodities (obviously not all of them) can only rise.
An hour precision chart indicates possible head and shoulder formation, negative RSI. Day precision chart indicates RSI almost at its 80s and if a divergence is to be build somewhere there is a high chance it is here.
Fundamental:
Low stockpile of copper in China has inspired a rally but at this level of stockpile ALWAYS in the past we have seen a move that rebuilds it fast within a month.
Take profit 2.5
It would be great to see gold retest 1850 from bottom and then all commodities could initiate a simultaneous correction. In the long term commodities (obviously not all of them) can only rise.

Clause de non-responsabilité
Les informations et publications ne sont pas destinées à être, et ne constituent pas, des conseils ou recommandations financiers, d'investissement, de trading ou autres fournis ou approuvés par TradingView. Pour en savoir plus, consultez les Conditions d'utilisation.
Clause de non-responsabilité
Les informations et publications ne sont pas destinées à être, et ne constituent pas, des conseils ou recommandations financiers, d'investissement, de trading ou autres fournis ou approuvés par TradingView. Pour en savoir plus, consultez les Conditions d'utilisation.