Long
$HOLX Correction Pattern
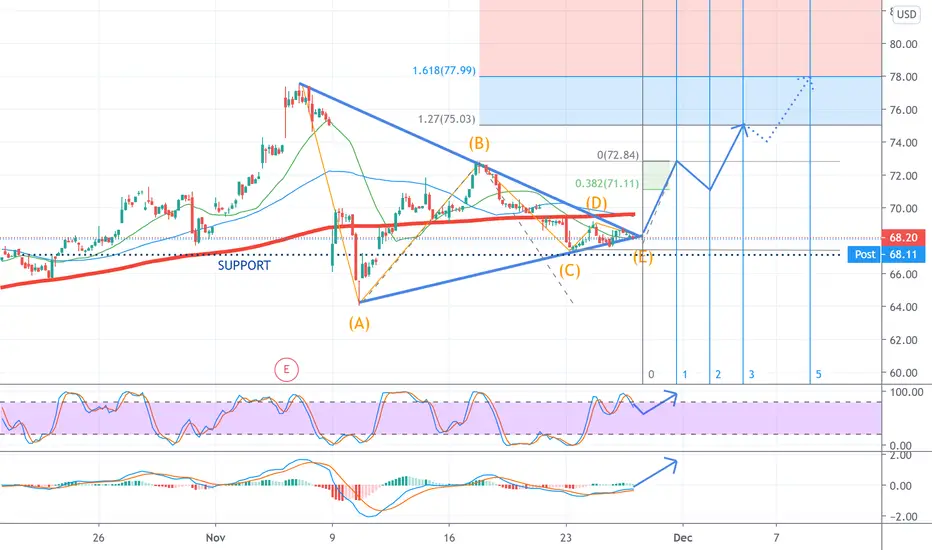
 HOLX
Testing Correction Pattern theory: Bull Pennant with support. In theory this is ready to bounce – fib trend would suggest 1.27 is at $75.
“I’m not an expert but I have watched a lot of youtube videos.”
$NASDAQ:HOLX
Note
Breaking the 200SMA will be key. If it resists, I think the chart will fail.Note
Held the bottom trend line - higher lows, extended-tighter consolidation... I think that tends to mean a larger gap up. I switched to the EMA chart today instead of the SMA and it broke the 50 day EMA and road the top side of the 20 day... I think the Chart is still in play. Let's see how it goes!Trade fermée: cible de profit atteinte
This may continue to go up more but taking some profit now.
Clause de non-responsabilité
Les informations et publications ne sont pas destinées à être, et ne constituent pas, des conseils ou recommandations financiers, d'investissement, de trading ou autres fournis ou approuvés par TradingView. Pour en savoir plus, consultez les Conditions d'utilisation.
Clause de non-responsabilité
Les informations et publications ne sont pas destinées à être, et ne constituent pas, des conseils ou recommandations financiers, d'investissement, de trading ou autres fournis ou approuvés par TradingView. Pour en savoir plus, consultez les Conditions d'utilisation.