
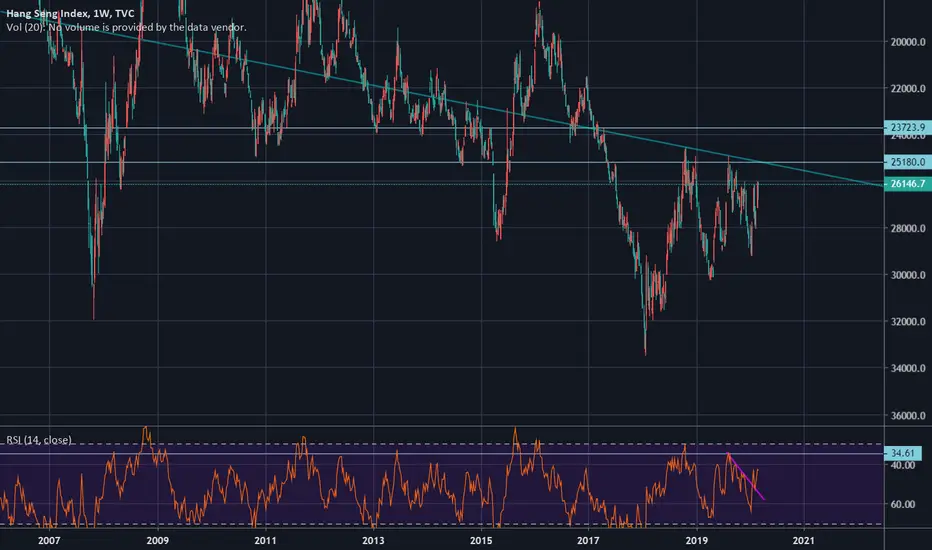
While everyone is trying catch a bottom, the HSI Inverted Weekly Chart gives a bearish view on the Hang Seng Index.
The candles from the last three weeks are bearish:
1) A Reversal Red Candle
2) A Gap with Solid Long Red Candle
3) Green Candle with Long Wick
In the coming two weeks it may hit and test the weekly support line at around 25180.
Let's see how the market reacts to the support level.
If selling is strong, it may break below 24000.

Clause de non-responsabilité
Les informations et publications ne sont pas destinées à être, et ne constituent pas, des conseils ou recommandations financiers, d'investissement, de trading ou autres fournis ou approuvés par TradingView. Pour en savoir plus, consultez les Conditions d'utilisation.
Clause de non-responsabilité
Les informations et publications ne sont pas destinées à être, et ne constituent pas, des conseils ou recommandations financiers, d'investissement, de trading ou autres fournis ou approuvés par TradingView. Pour en savoir plus, consultez les Conditions d'utilisation.