Long
$HTZ technical analysis "HTZ"
$NYSE:HTZ
Lot's of bullish signs/patterns played out and are playing out.
If the bottom is in, then we would have formed a double bottom = bullish.
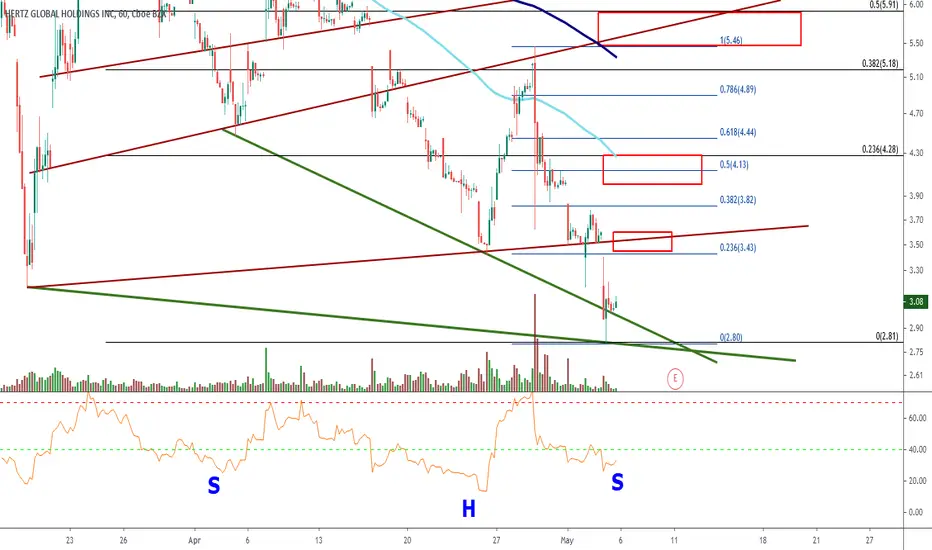
Today's price action resemble a SFP (swing failure pattern) = bullish.
Many bullish divergences on multiple time frames (1hr, 4hr, 1day, weekly) = bullish.
Inverse head and shoulders pattern looks to be completing right shoulder on multiple time frames = bullish.
Recent volume price is declining = bullish.
In the chart I have sell zone boxes in red where I am looking to sell parts of my position.
They also correspond with the red diagonal resistance lines I drew and several EMA's (exponential moving averages: 100, 200, 250, 300)
The green trend lines show support areas.
We don't want price to fall below those areas.
Good luck to all and God bless!
Lot's of bullish signs/patterns played out and are playing out.
If the bottom is in, then we would have formed a double bottom = bullish.
Today's price action resemble a SFP (swing failure pattern) = bullish.
Many bullish divergences on multiple time frames (1hr, 4hr, 1day, weekly) = bullish.
Inverse head and shoulders pattern looks to be completing right shoulder on multiple time frames = bullish.
Recent volume price is declining = bullish.
In the chart I have sell zone boxes in red where I am looking to sell parts of my position.
They also correspond with the red diagonal resistance lines I drew and several EMA's (exponential moving averages: 100, 200, 250, 300)
The green trend lines show support areas.
We don't want price to fall below those areas.
Good luck to all and God bless!

Clause de non-responsabilité
Les informations et publications ne sont pas destinées à être, et ne constituent pas, des conseils ou recommandations financiers, d'investissement, de trading ou autres fournis ou approuvés par TradingView. Pour en savoir plus, consultez les Conditions d'utilisation.
Clause de non-responsabilité
Les informations et publications ne sont pas destinées à être, et ne constituent pas, des conseils ou recommandations financiers, d'investissement, de trading ou autres fournis ou approuvés par TradingView. Pour en savoir plus, consultez les Conditions d'utilisation.