Ok let me start with something clear and this is absolutely my opinion and not a financial advice. I chart this for the "short" term but this one will sit in my portfolio for the next 10 years. I believe we are very early in this and at this point, I don't really care about "good entries". Again NOT A FINANCIAL ADVICE this is purely speculative.
On to the chart!
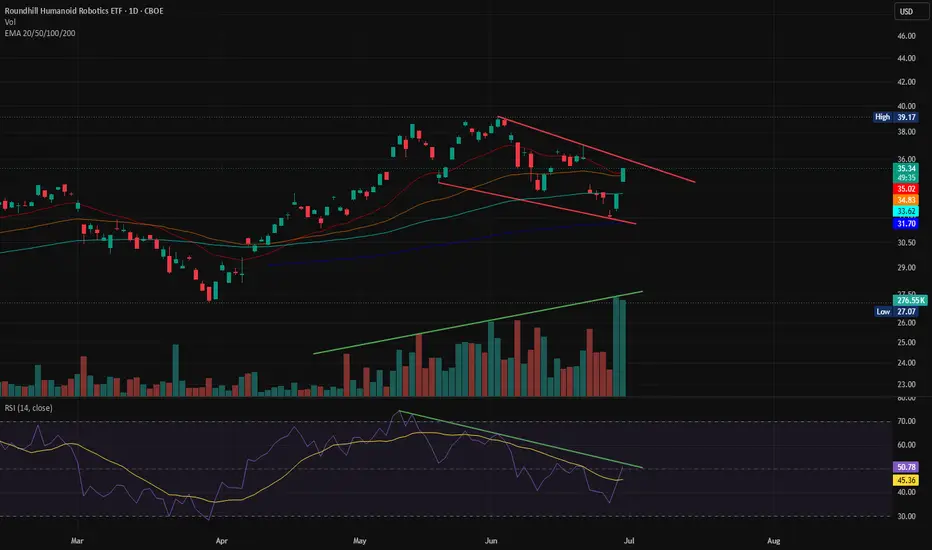
 HUMN is up with a strong daily candle, up over 5 percent, a daily close like this is lovelyyyyy, but the ETF remains in the wedge. Price reclaimed the 20 and 50 EMAs. The recent pullback held the 100 EMA at 33.62.
Volume is crazy on this one and today printed the biggest green volume bar in months. RSI at 50.78, back above its average and breaking its downtrend line. Price breakout, RSI breakout and volume spike all line up. RSI needs to hold above 50 over the next sessions to confirm it is not a one day bounce.
What is want: Hold above 35 into the close. Keep the 100 EMA untouched from above. Then clear the 36 to 38 zone before the 39.17 high. Lose 34.83 and it falls back into the wedge.
On to the chart!
HUMN is up with a strong daily candle, up over 5 percent, a daily close like this is lovelyyyyy, but the ETF remains in the wedge. Price reclaimed the 20 and 50 EMAs. The recent pullback held the 100 EMA at 33.62. Volume is crazy on this one and today printed the biggest green volume bar in months. RSI at 50.78, back above its average and breaking its downtrend line. Price breakout, RSI breakout and volume spike all line up. RSI needs to hold above 50 over the next sessions to confirm it is not a one day bounce.
What is want: Hold above 35 into the close. Keep the 100 EMA untouched from above. Then clear the 36 to 38 zone before the 39.17 high. Lose 34.83 and it falls back into the wedge.

Clause de non-responsabilité
Les informations et publications ne sont pas destinées à être, et ne constituent pas, des conseils ou recommandations financiers, d'investissement, de trading ou autres fournis ou approuvés par TradingView. Pour en savoir plus, consultez les Conditions d'utilisation.
Clause de non-responsabilité
Les informations et publications ne sont pas destinées à être, et ne constituent pas, des conseils ou recommandations financiers, d'investissement, de trading ou autres fournis ou approuvés par TradingView. Pour en savoir plus, consultez les Conditions d'utilisation.