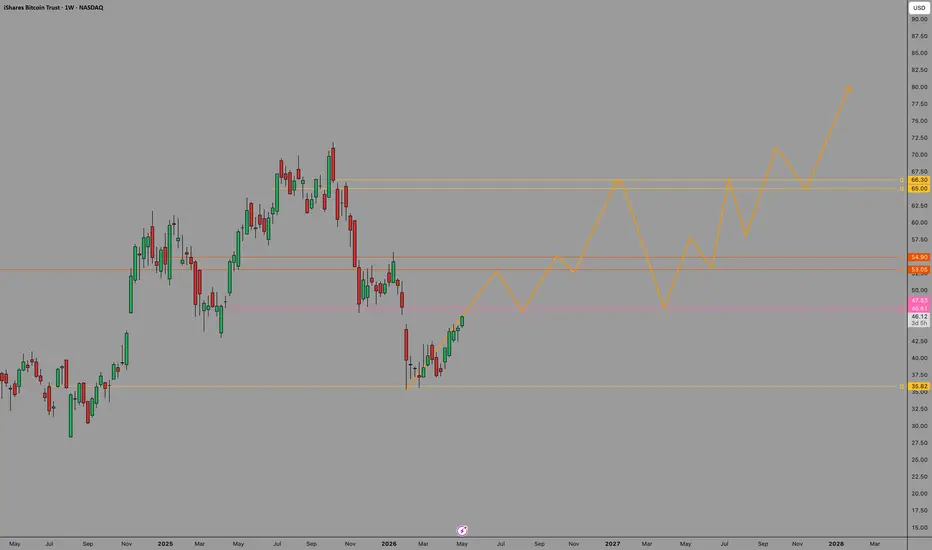
 IBIT — Weekly
One level matters right now: $47.
That's the flip zone. Resistance needs to become support before this moves anywhere meaningful.
If it holds:
→ Rally into year-end
→ Flush in 2027 (shakeout, not the end)
→ New ATH by 2028
Invalidation: lose $35.82 on the weekly and the thesis is dead.
Not financial advice. Just watching the map.
Transaction en cours
Update: Re-reading this idea, the original map was off. The real question was never $47. It was where the bottom forms.What the structure shows now:
→ Low: summer 2026, ~$33
→ Higher high: September pushed to ~$49, breaking the last lower high. First crack in the downtrend.
→ Now: the pullback needs to hold the $40–44 area and form a higher low
If that higher low holds:
→ Break above $49 = confirmation of the new uptrend
→ Rally toward $53–55, then $65–66
→ 2027 pullback (shakeout, not the end)
→ New ATH (~$80) by 2028
Invalidation:
- A weekly close below $40 = higher low failed, and I'd reassess
- A weekly close below $33 = the bottom isn't in, and the thesis is dead
Not financial advice. Bottom → higher high → higher low. Now we test step 3.

Clause de non-responsabilité
Les informations et publications ne sont pas destinées à être, et ne constituent pas, des conseils ou recommandations financiers, d'investissement, de trading ou autres fournis ou approuvés par TradingView. Pour en savoir plus, consultez les Conditions d'utilisation.
Clause de non-responsabilité
Les informations et publications ne sont pas destinées à être, et ne constituent pas, des conseils ou recommandations financiers, d'investissement, de trading ou autres fournis ou approuvés par TradingView. Pour en savoir plus, consultez les Conditions d'utilisation.