
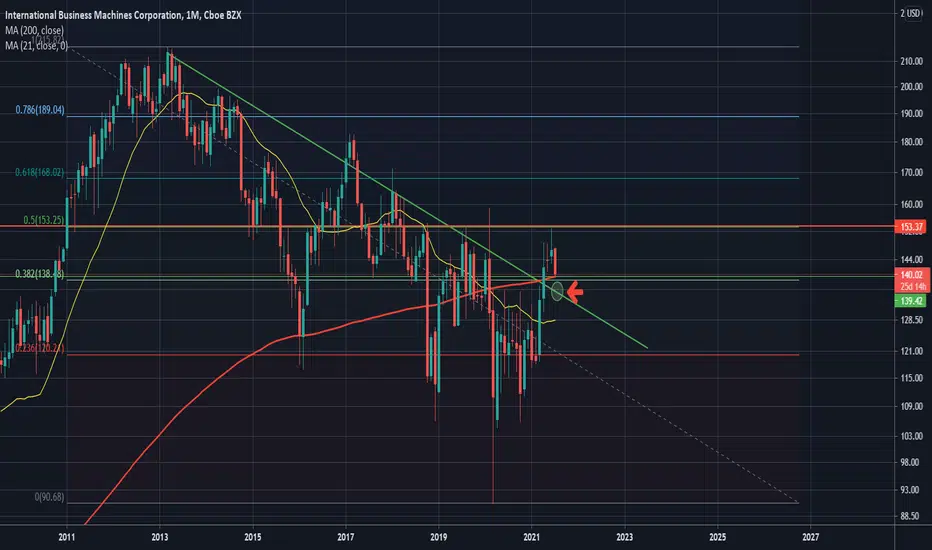
This is a short-term possibly bearish post within a longer term bullish play. Last week IBM closed out with a big 4.5% drop in one day after news of the CEO resigning. But was this the cause or was something larger perhaps in the chart in play here?
Well when we zoom out on the monthly chart, we see back in April this year IBM broke aggressively bullish out of the downward sloping green trendline and went straight to the 0.5 fib level around $153. What was missing on this move however, was a confirming retest of the green trendline. It appears the bulls were front runners of the price, and now the retest of the green broken trendline is still well in play. There is lots of bullish confluence where the price currently sits, however. So it will be interesting to see how IBM's price will behave both this week as well as the remainder of this new month. Right now is a decent area to nibble on a long but be on the lookout for a retest of the green trendline and keep stop losses tight as this has been a roller coaster of an asset.
Well when we zoom out on the monthly chart, we see back in April this year IBM broke aggressively bullish out of the downward sloping green trendline and went straight to the 0.5 fib level around $153. What was missing on this move however, was a confirming retest of the green trendline. It appears the bulls were front runners of the price, and now the retest of the green broken trendline is still well in play. There is lots of bullish confluence where the price currently sits, however. So it will be interesting to see how IBM's price will behave both this week as well as the remainder of this new month. Right now is a decent area to nibble on a long but be on the lookout for a retest of the green trendline and keep stop losses tight as this has been a roller coaster of an asset.

Clause de non-responsabilité
Les informations et publications ne sont pas destinées à être, et ne constituent pas, des conseils ou recommandations financiers, d'investissement, de trading ou autres fournis ou approuvés par TradingView. Pour en savoir plus, consultez les Conditions d'utilisation.
Clause de non-responsabilité
Les informations et publications ne sont pas destinées à être, et ne constituent pas, des conseils ou recommandations financiers, d'investissement, de trading ou autres fournis ou approuvés par TradingView. Pour en savoir plus, consultez les Conditions d'utilisation.