
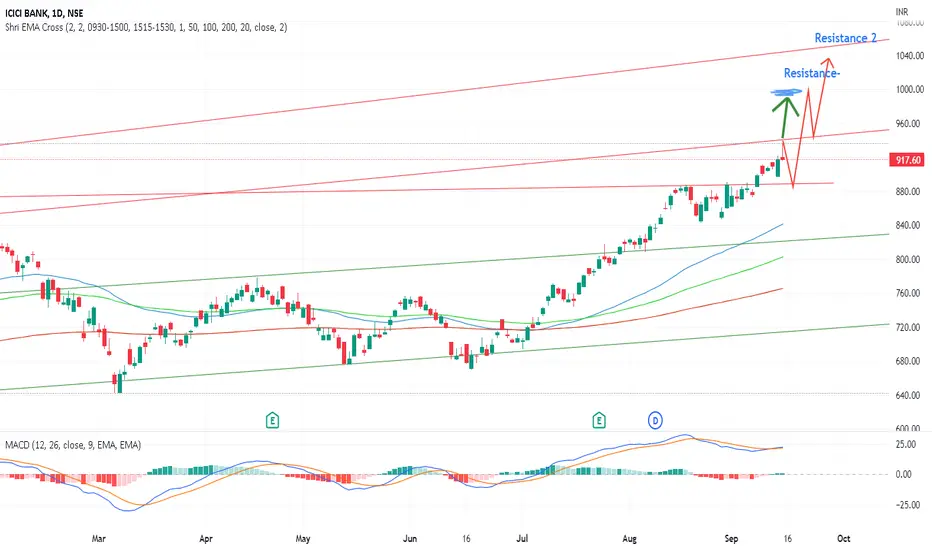
ICICIBANK - in daily chart macd line is above macd signal line and rsi not in overbought zone and 3 ema in cross above eachothers......
1. First resistance is 1000
2. Resistance is long trendline as per weekly chart
3. RSI not in overbought zone in - MONTHLY CHART
4. RSI not in overbought zone in - WEEKLY CHART
5. MACD line crossed above in monthly weekly chart
If you found helpful please like
Thank You0
1. First resistance is 1000
2. Resistance is long trendline as per weekly chart
3. RSI not in overbought zone in - MONTHLY CHART
4. RSI not in overbought zone in - WEEKLY CHART
5. MACD line crossed above in monthly weekly chart
If you found helpful please like
Thank You0

Clause de non-responsabilité
Les informations et publications ne sont pas destinées à être, et ne constituent pas, des conseils ou recommandations financiers, d'investissement, de trading ou autres fournis ou approuvés par TradingView. Pour en savoir plus, consultez les Conditions d'utilisation.
Clause de non-responsabilité
Les informations et publications ne sont pas destinées à être, et ne constituent pas, des conseils ou recommandations financiers, d'investissement, de trading ou autres fournis ou approuvés par TradingView. Pour en savoir plus, consultez les Conditions d'utilisation.