
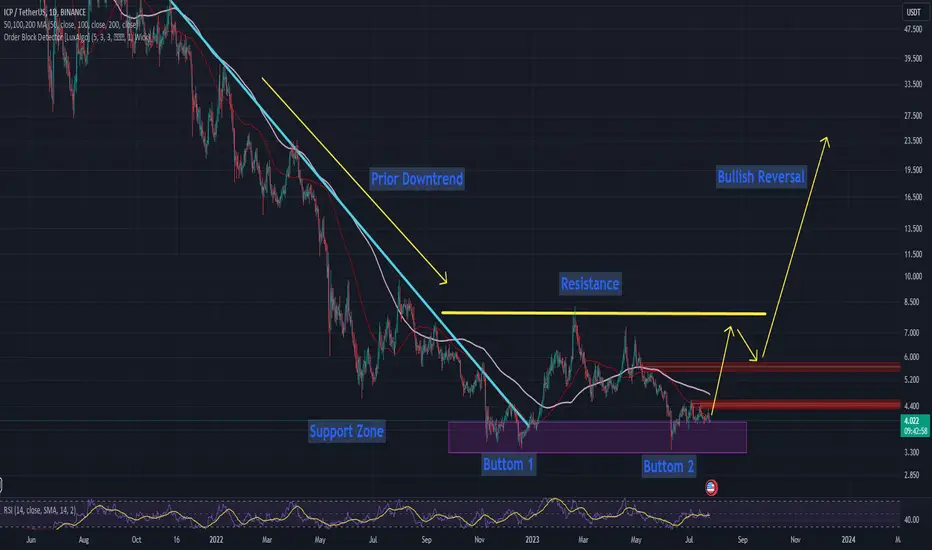
A double bottom pattern is a classical pattern that indicates a change in trend and a shift in momentum from bearish to bullish. It is composed of two consecutive troughs that bottom out at roughly the same price level. This level acts as a support for the price. The double bottom formation is a bullish reversal pattern that is created after a prolonged downtrend. In order to identify this pattern, you will need to look for the following:
1. Two distinct troughs that bottom out at roughly the same price level.
2. A moderate rally in between the two troughs, creating a resistance.
3. A break above the resistance after the 2nd trough is formed.
If you see a chart with these characteristics, you have recognized a double bottom pattern.
This pattern is regarded as a very reliable reversal signal, and traders frequently use it to enter long positions.
1. Two distinct troughs that bottom out at roughly the same price level.
2. A moderate rally in between the two troughs, creating a resistance.
3. A break above the resistance after the 2nd trough is formed.
If you see a chart with these characteristics, you have recognized a double bottom pattern.
This pattern is regarded as a very reliable reversal signal, and traders frequently use it to enter long positions.
Note
Liquidation MapShort 🩸 🩸🩸 3 M ⚠️ -> $4.48
Longs ✅✅ ✅ 300 k -> $3.6
Note
Liquidation MapShort 🩸 🩸🩸 5.32 M ⚠️⚠️⚠️ -> $ 4.5
Longs ✅✅ ✅ 100 k -> $3.12
Transaction en cours
The upward price explosion liquidating the shorts can be monstrous.Transaction en cours
The idea is still valid. ✅✅✅It is a long-term position 💎💎💎
Transaction en cours
First resistance 4.5 -> BROKEN ✅Second resistance 5.7 -> In progress 💎
Transaction en cours
First resistance 4.5 -> BROKEN ✅Second resistance 5.7 -> BROKEN ✅
Transaction en cours
Thanks to everyone who supported me, enjoy the profits. This is for the long term!
Clause de non-responsabilité
Les informations et publications ne sont pas destinées à être, et ne constituent pas, des conseils ou recommandations financiers, d'investissement, de trading ou autres fournis ou approuvés par TradingView. Pour en savoir plus, consultez les Conditions d'utilisation.
Clause de non-responsabilité
Les informations et publications ne sont pas destinées à être, et ne constituent pas, des conseils ou recommandations financiers, d'investissement, de trading ou autres fournis ou approuvés par TradingView. Pour en savoir plus, consultez les Conditions d'utilisation.