
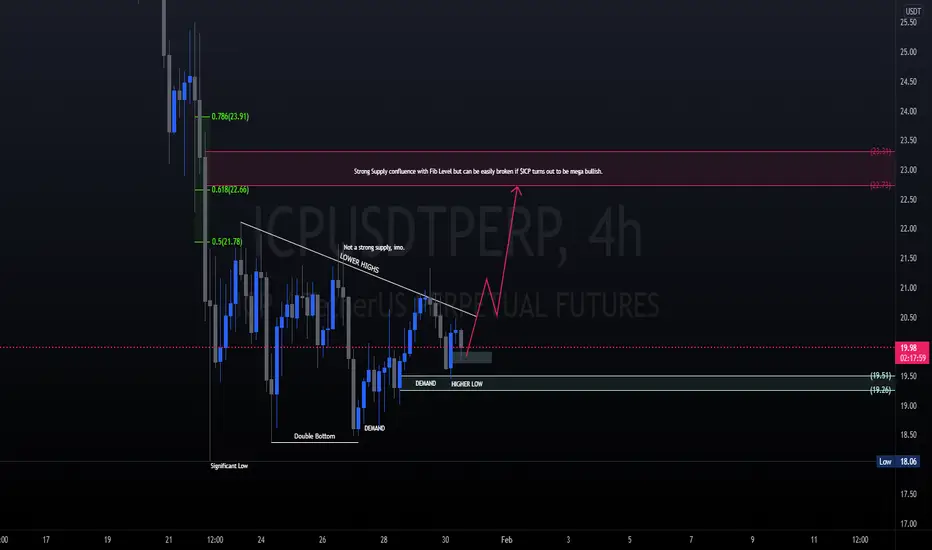
In this chart,
I identified the following:
- Nearest Strong Supply area for 4H (there's a hidden demand there if you go for an LTF )
- Lower Highs
- Higher Lows
- LH + HL = Triangle
- Price gets rejected three times trying to break but still got rejected but selling pressure is not enough to continue the price to the downside and break the triangle
- We saw a double bottom causing the price to increase which left a good footprint to buy again and rally to the next high but eventually traded lower again and found a new demand zone
I have an entry at 19.7, 20.14, 20.18
Looking to swing this to $30 if possible it gets a 60%+ price increase the following days (especially this week) 1st week of February.

Clause de non-responsabilité
Les informations et publications ne sont pas destinées à être, et ne constituent pas, des conseils ou recommandations financiers, d'investissement, de trading ou autres fournis ou approuvés par TradingView. Pour en savoir plus, consultez les Conditions d'utilisation.
Clause de non-responsabilité
Les informations et publications ne sont pas destinées à être, et ne constituent pas, des conseils ou recommandations financiers, d'investissement, de trading ou autres fournis ou approuvés par TradingView. Pour en savoir plus, consultez les Conditions d'utilisation.