Long
Icon (ICX) Weekly Chart | Falling Wedge | Targets
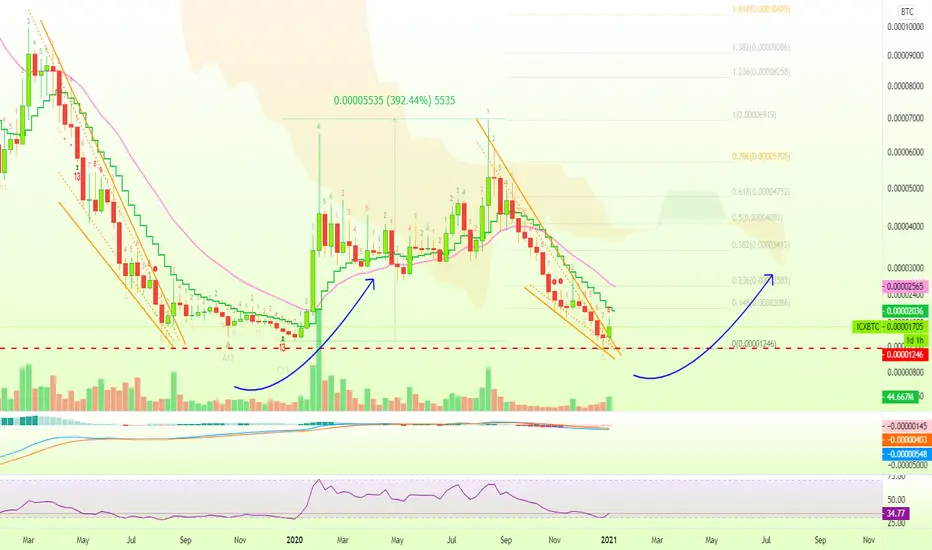
Let's compare the left side to the right side of the ICXBTC (Icon) chart... What do you see?
We have, to the left first, a falling wedge that was followed by a 390%+ bullish wave.
We have, to the right, a falling wedge that is likely to be followed by another bullish wave...
This is how the markets work.
They move in cycles/waves.
It goes up and down, up and down...
It is going DOWN...
It is time to go UP!
Namaste.
We have, to the left first, a falling wedge that was followed by a 390%+ bullish wave.
We have, to the right, a falling wedge that is likely to be followed by another bullish wave...
This is how the markets work.
They move in cycles/waves.
It goes up and down, up and down...
It is going DOWN...
It is time to go UP!
Namaste.

✅ Cryptocurrencies technical analysis & results
t.me/masteranandatrades/9279
✅ Stocks technical analysis
t.me/anandastocks
✅ Enjoyed the content? Join my PREMIUM channels for more... t.me/lamatrades/4 (since 2017)
t.me/masteranandatrades/9279
✅ Stocks technical analysis
t.me/anandastocks
✅ Enjoyed the content? Join my PREMIUM channels for more... t.me/lamatrades/4 (since 2017)
Publications connexes
Clause de non-responsabilité
Les informations et publications ne sont pas destinées à être, et ne constituent pas, des conseils ou recommandations financiers, d'investissement, de trading ou autres fournis ou approuvés par TradingView. Pour en savoir plus, consultez les Conditions d'utilisation.
✅ Cryptocurrencies technical analysis & results
t.me/masteranandatrades/9279
✅ Stocks technical analysis
t.me/anandastocks
✅ Enjoyed the content? Join my PREMIUM channels for more... t.me/lamatrades/4 (since 2017)
t.me/masteranandatrades/9279
✅ Stocks technical analysis
t.me/anandastocks
✅ Enjoyed the content? Join my PREMIUM channels for more... t.me/lamatrades/4 (since 2017)
Publications connexes
Clause de non-responsabilité
Les informations et publications ne sont pas destinées à être, et ne constituent pas, des conseils ou recommandations financiers, d'investissement, de trading ou autres fournis ou approuvés par TradingView. Pour en savoir plus, consultez les Conditions d'utilisation.