
✅ Current snapshot
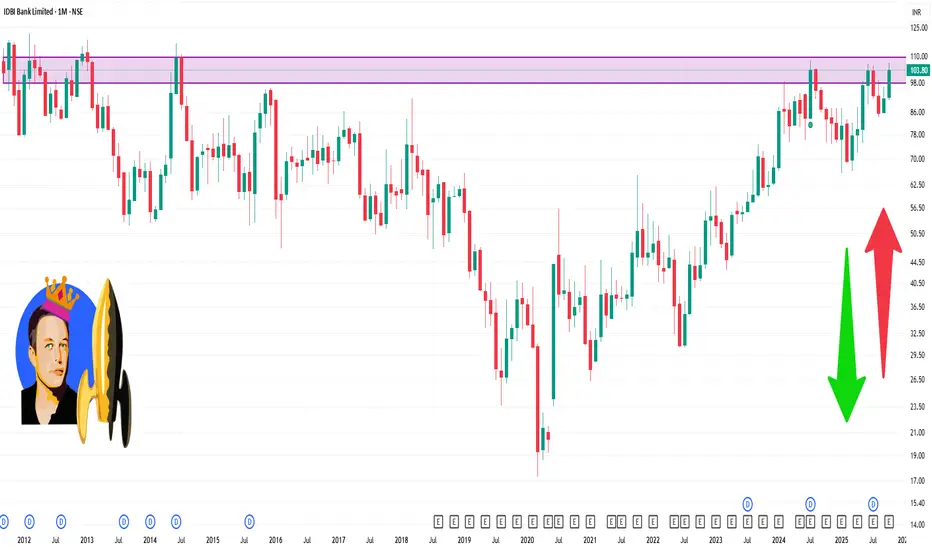
Stock is trading around ₹ 93-100 (recent levels).
52-week high ~ ₹ 106.3, 52-week low ~ ₹ 65.9.
Technical summary (monthly time-frame) shows indicators leaning “Strong Buy” overall according to one provider.
Fundamentals: P/E ~ ~10-11x, book value ~ ₹63-64 (various sources) and modest dividend yield (~2.2%).
Key development: The government + Life Insurance Corporation of India (LIC) are moving ahead with strategic changes for IDBI (which could provide medium-term tailwinds).
Stock is trading around ₹ 93-100 (recent levels).
52-week high ~ ₹ 106.3, 52-week low ~ ₹ 65.9.
Technical summary (monthly time-frame) shows indicators leaning “Strong Buy” overall according to one provider.
Fundamentals: P/E ~ ~10-11x, book value ~ ₹63-64 (various sources) and modest dividend yield (~2.2%).
Key development: The government + Life Insurance Corporation of India (LIC) are moving ahead with strategic changes for IDBI (which could provide medium-term tailwinds).

Contact Knowledgehub for a detailed consultation: Dm on WhatsApp: [wa.link/a2o0kz]-
Phone No: [+91 93102 26243]-
Email: [tradingviewknowledgehub@gmail.com]---
-- Let’s achieve success together!
Phone No: [+91 93102 26243]-
Email: [tradingviewknowledgehub@gmail.com]---
-- Let’s achieve success together!
Publications connexes
Clause de non-responsabilité
Les informations et publications ne sont pas destinées à être, et ne constituent pas, des conseils ou recommandations financiers, d'investissement, de trading ou autres fournis ou approuvés par TradingView. Pour en savoir plus, consultez les Conditions d'utilisation.
Contact Knowledgehub for a detailed consultation: Dm on WhatsApp: [wa.link/a2o0kz]-
Phone No: [+91 93102 26243]-
Email: [tradingviewknowledgehub@gmail.com]---
-- Let’s achieve success together!
Phone No: [+91 93102 26243]-
Email: [tradingviewknowledgehub@gmail.com]---
-- Let’s achieve success together!
Publications connexes
Clause de non-responsabilité
Les informations et publications ne sont pas destinées à être, et ne constituent pas, des conseils ou recommandations financiers, d'investissement, de trading ou autres fournis ou approuvés par TradingView. Pour en savoir plus, consultez les Conditions d'utilisation.