
Not every correction is the beginning of a new downtrend.
Sometimes, it's simply the market resetting before the next impulse higher.
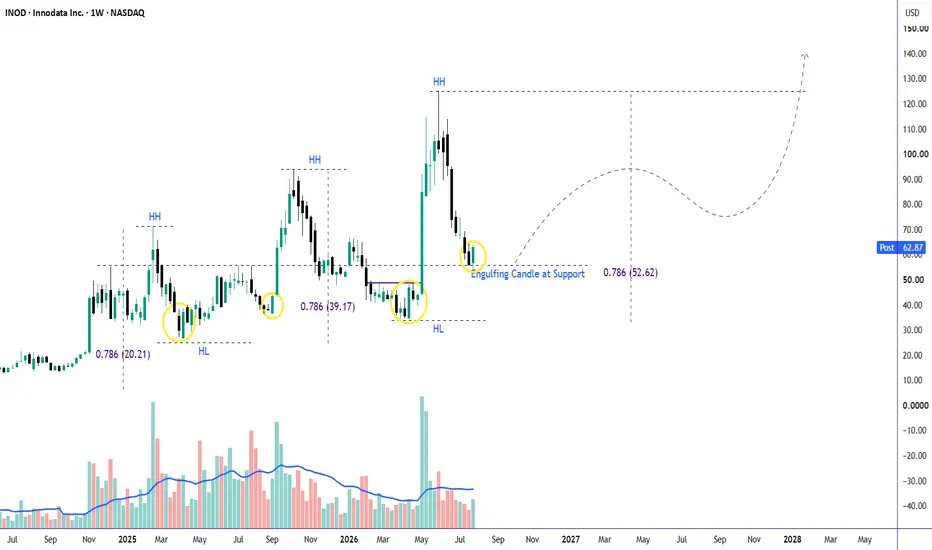
Looking at INOD's weekly chart, an interesting pattern keeps repeating.
🔄 A Familiar Cycle
Over the past several major advances, price has consistently followed a similar sequence:
✅ Strong impulsive rally
📉 Deep correction toward the 78.6% Fibonacci retracement
🟢 Weekly bullish engulfing candle near support
📈 Higher rebound volume
🚀 New Higher High
This behavior has now appeared multiple times.
📍 Why 78.6% Matters
The 78.6% retracement is often the deepest pullback that still preserves the broader uptrend.
While many traders expect reversals around the 50% or 61.8% levels, strong momentum stocks frequently shake out late buyers before resuming higher.
INOD has repeatedly respected this area during previous corrections.
🟢 The Current Setup
Price has once again retraced close to the 78.6% Fibonacci level, where buyers stepped in with a bullish weekly engulfing candle.
Just as importantly:
📊 Rebound volume is beginning to expand, echoing previous bottoms.
That combination suggests buyers may once again be defending this historical demand zone.
🎯 What Happens Next?
If history continues to rhyme, this area could become another Higher Low, setting the stage for the next impulsive advance.
The first objective would be a retest of the previous Higher High near 125.
A successful breakout above that level would confirm another leg higher and continue the long-term uptrend.
❌ Invalidation
A decisive weekly close below the current support zone and sustained trading beneath the 78.6% retracement would weaken this historical pattern and increase the probability of a deeper structural correction.
🧠 Key Takeaway
Markets rarely move randomly.
When a stock repeatedly reacts at the same level with the same combination of price action and volume behavior, it deserves attention.
History never repeats perfectly—but it often rhymes.
⚠️ This analysis is for educational purposes only and reflects my interpretation of price action and market structure. It is not financial advice. Always manage risk and conduct your own research.
Sometimes, it's simply the market resetting before the next impulse higher.
Looking at INOD's weekly chart, an interesting pattern keeps repeating.
🔄 A Familiar Cycle
Over the past several major advances, price has consistently followed a similar sequence:
✅ Strong impulsive rally
📉 Deep correction toward the 78.6% Fibonacci retracement
🟢 Weekly bullish engulfing candle near support
📈 Higher rebound volume
🚀 New Higher High
This behavior has now appeared multiple times.
📍 Why 78.6% Matters
The 78.6% retracement is often the deepest pullback that still preserves the broader uptrend.
While many traders expect reversals around the 50% or 61.8% levels, strong momentum stocks frequently shake out late buyers before resuming higher.
INOD has repeatedly respected this area during previous corrections.
🟢 The Current Setup
Price has once again retraced close to the 78.6% Fibonacci level, where buyers stepped in with a bullish weekly engulfing candle.
Just as importantly:
📊 Rebound volume is beginning to expand, echoing previous bottoms.
That combination suggests buyers may once again be defending this historical demand zone.
🎯 What Happens Next?
If history continues to rhyme, this area could become another Higher Low, setting the stage for the next impulsive advance.
The first objective would be a retest of the previous Higher High near 125.
A successful breakout above that level would confirm another leg higher and continue the long-term uptrend.
❌ Invalidation
A decisive weekly close below the current support zone and sustained trading beneath the 78.6% retracement would weaken this historical pattern and increase the probability of a deeper structural correction.
🧠 Key Takeaway
Markets rarely move randomly.
When a stock repeatedly reacts at the same level with the same combination of price action and volume behavior, it deserves attention.
History never repeats perfectly—but it often rhymes.
⚠️ This analysis is for educational purposes only and reflects my interpretation of price action and market structure. It is not financial advice. Always manage risk and conduct your own research.

📊 Charts → 🏗️ Structure → 🎯 Probability =📖 Chart Story
⏳ Patience → 🚀Success
🎯 If this setup makes sense to you, show it some support with a Boost.
⏳ Patience → 🚀Success
🎯 If this setup makes sense to you, show it some support with a Boost.
Clause de non-responsabilité
Les informations et publications ne sont pas destinées à être, et ne constituent pas, des conseils ou recommandations financiers, d'investissement, de trading ou autres fournis ou approuvés par TradingView. Pour en savoir plus, consultez les Conditions d'utilisation.
📊 Charts → 🏗️ Structure → 🎯 Probability =📖 Chart Story
⏳ Patience → 🚀Success
🎯 If this setup makes sense to you, show it some support with a Boost.
⏳ Patience → 🚀Success
🎯 If this setup makes sense to you, show it some support with a Boost.
Clause de non-responsabilité
Les informations et publications ne sont pas destinées à être, et ne constituent pas, des conseils ou recommandations financiers, d'investissement, de trading ou autres fournis ou approuvés par TradingView. Pour en savoir plus, consultez les Conditions d'utilisation.