
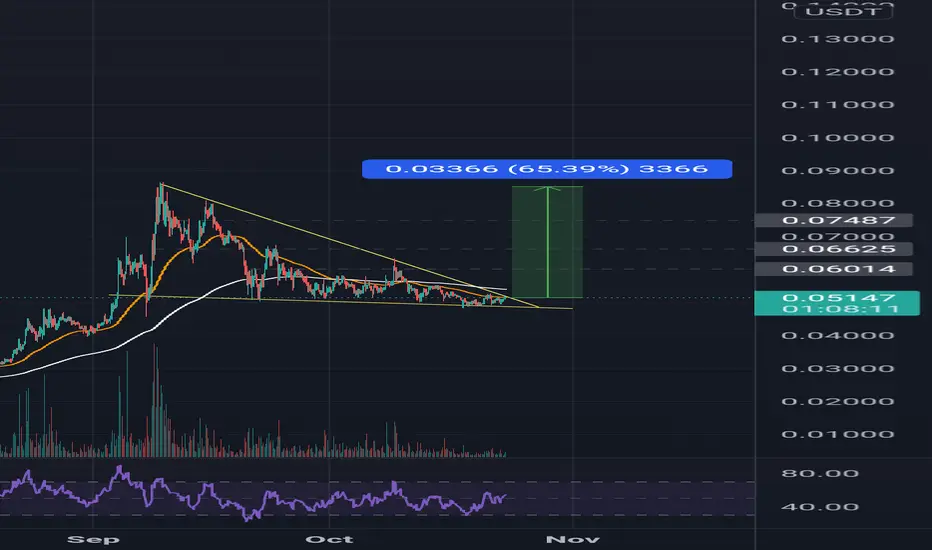
The chart is showing a falling wedge, which is a bullish pattern.We will see a a breakout in upcoming days.
If it manage to break the resistant trendline ,We will see the marked target soon.
0.13$ (1.618 FIB) is the realistic target.
Happy trading 💥
- Showing a bullish momentum
- The price is above SMA which is bullish
- MACD is showing a possible bullish momentum
- RSI is neutral ; More rooms to grow
- currently sittingon 0.5FIB
If it manage to break the resistant trendline ,We will see the marked target soon.
0.13$ (1.618 FIB) is the realistic target.
Happy trading 💥

Clause de non-responsabilité
Les informations et publications ne sont pas destinées à être, et ne constituent pas, des conseils ou recommandations financiers, d'investissement, de trading ou autres fournis ou approuvés par TradingView. Pour en savoir plus, consultez les Conditions d'utilisation.
Clause de non-responsabilité
Les informations et publications ne sont pas destinées à être, et ne constituent pas, des conseils ou recommandations financiers, d'investissement, de trading ou autres fournis ou approuvés par TradingView. Pour en savoir plus, consultez les Conditions d'utilisation.