
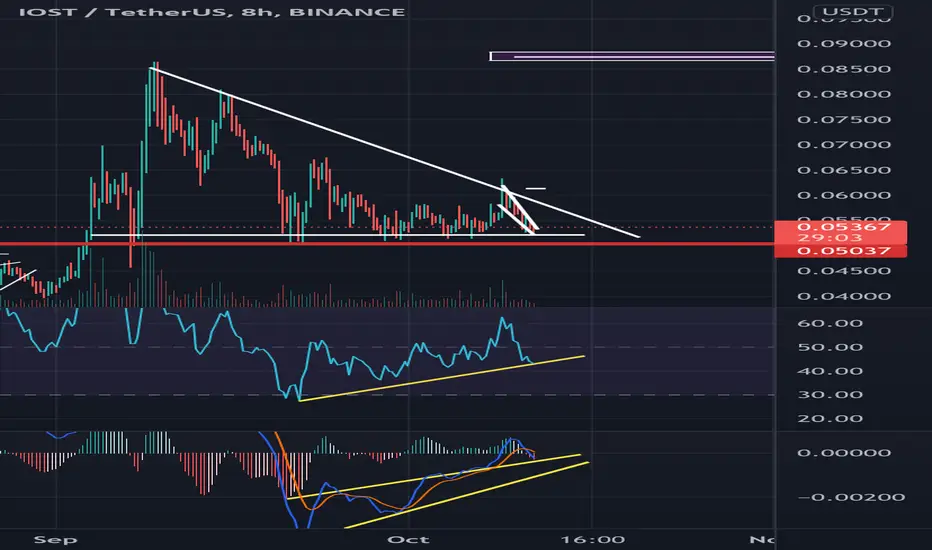
IOST at bottom of Triangle Pattern that has held the bottom above $0.05000 since 09/07/21. Exaggerated Divergence on 8 hour chart on MACD, RSI, and Histogram. Also in smaller falling wedge pattern on smaller time frame with brake out bringing price action out of triangle pattern to $0.06100. Probably see some resistance around there. Then possibly up to $0.085 plus.

Clause de non-responsabilité
Les informations et publications ne sont pas destinées à être, et ne constituent pas, des conseils ou recommandations financiers, d'investissement, de trading ou autres fournis ou approuvés par TradingView. Pour en savoir plus, consultez les Conditions d'utilisation.
Clause de non-responsabilité
Les informations et publications ne sont pas destinées à être, et ne constituent pas, des conseils ou recommandations financiers, d'investissement, de trading ou autres fournis ou approuvés par TradingView. Pour en savoir plus, consultez les Conditions d'utilisation.