
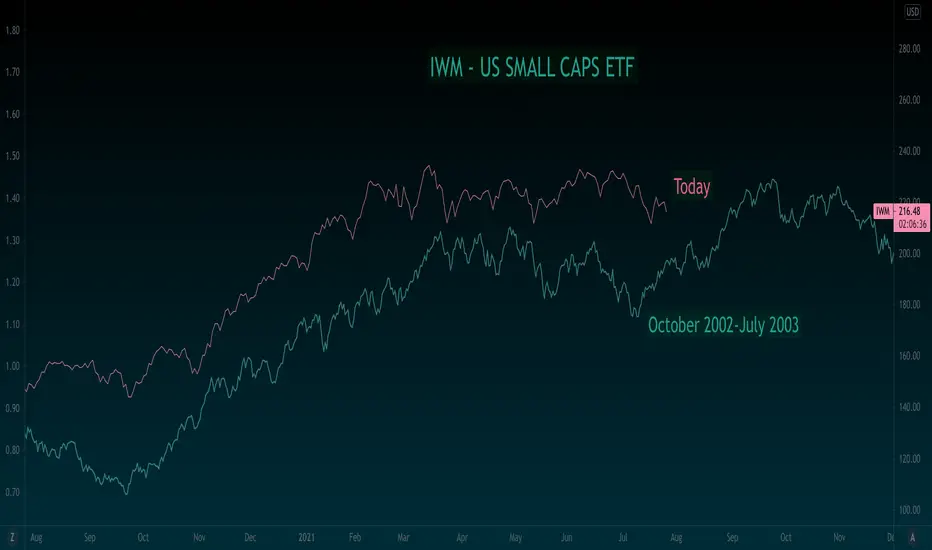
In this chart we analyze the relationship between the Small Cap iShares ETF and an analog of the 2002-2003 price action. From our view, we can see that we are clearly holding a similar pattern from back in the early part of that decade. This happened to be after a recession as well where the value/growth rotations were just as if not stronger than they are today. Something to keep in mind.
In short, we are bullish on the small cap sector from here. The risk reward is clear vs the recent range lows on the daily chart for a sustained move over the coming months higher.
In short, we are bullish on the small cap sector from here. The risk reward is clear vs the recent range lows on the daily chart for a sustained move over the coming months higher.

Clause de non-responsabilité
Les informations et publications ne sont pas destinées à être, et ne constituent pas, des conseils ou recommandations financiers, d'investissement, de trading ou autres fournis ou approuvés par TradingView. Pour en savoir plus, consultez les Conditions d'utilisation.
Clause de non-responsabilité
Les informations et publications ne sont pas destinées à être, et ne constituent pas, des conseils ou recommandations financiers, d'investissement, de trading ou autres fournis ou approuvés par TradingView. Pour en savoir plus, consultez les Conditions d'utilisation.