
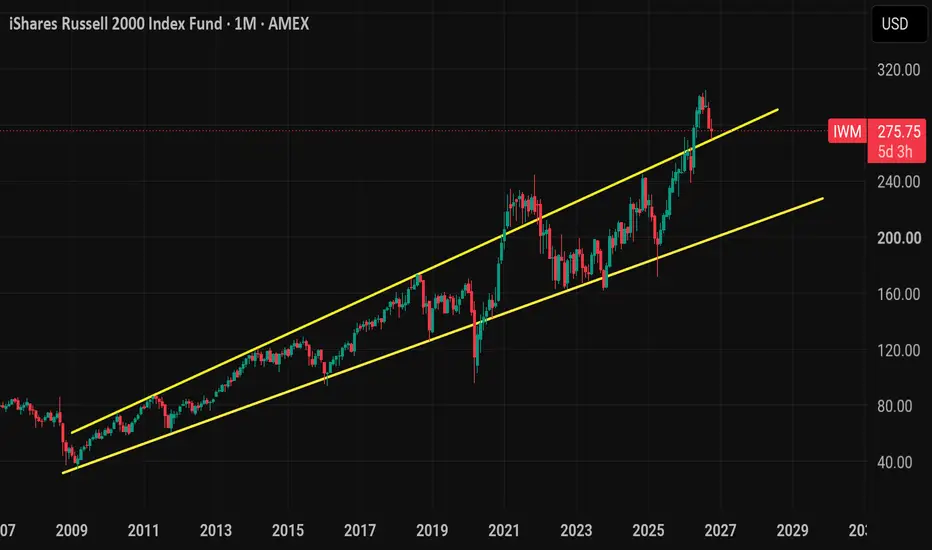
Interesting setup here
Long term, we retesting our previous monthly resistance. A breakout like this happened back during COVID with the stimulus money, but it didn't last. I think after this seasonal run up back to 295-300 we will begin a decline back inside long term channel

Here's a close up of August reversal monthly candle. August closed around 295 and that is where Sellers will be waiting for iwm up there

Now zooming into the weekly , and this is why I think Iwm will bounce.
Since 2009 iwm weekly money flow has only tagged extreme oversold 3 prior times up until now and each time iwm bottomed and rallied for awhile. The positioning was different though; we where at the support where as now we are on top of resistance.

So from this , you have a unsustainable structure with oversold conditions.
I give the edge to the bulls here because of the money flow and seasonality
IWM November seasonality · 2000–2025
81%
Positive Novembers
+3.0%
Average return
21/26
Positive years
As they say, numbers don't lie.
Daily chart

Important price levels
$295–$305 Major upside objective
Prior peak and upper resistance region
$284–$285 First significant hurdle
Early-October reaction area
$277–$280 Immediate decision zone
Near-term resistance and former confluence
$269–$271 Support / failed-bounce warning
Recent swing-low region
Below ~$265 Deeper breakdown risk
Would strengthen the return-inside-channel thesis
I think the low will be set this week and if 265 holds 295 by end of NOV
Long term, we retesting our previous monthly resistance. A breakout like this happened back during COVID with the stimulus money, but it didn't last. I think after this seasonal run up back to 295-300 we will begin a decline back inside long term channel
Here's a close up of August reversal monthly candle. August closed around 295 and that is where Sellers will be waiting for iwm up there
Now zooming into the weekly , and this is why I think Iwm will bounce.
Since 2009 iwm weekly money flow has only tagged extreme oversold 3 prior times up until now and each time iwm bottomed and rallied for awhile. The positioning was different though; we where at the support where as now we are on top of resistance.
So from this , you have a unsustainable structure with oversold conditions.
I give the edge to the bulls here because of the money flow and seasonality
IWM November seasonality · 2000–2025
81%
Positive Novembers
+3.0%
Average return
21/26
Positive years
As they say, numbers don't lie.
Daily chart
Important price levels
$295–$305 Major upside objective
Prior peak and upper resistance region
$284–$285 First significant hurdle
Early-October reaction area
$277–$280 Immediate decision zone
Near-term resistance and former confluence
$269–$271 Support / failed-bounce warning
Recent swing-low region
Below ~$265 Deeper breakdown risk
Would strengthen the return-inside-channel thesis
I think the low will be set this week and if 265 holds 295 by end of NOV

Clause de non-responsabilité
Les informations et publications ne sont pas destinées à être, et ne constituent pas, des conseils ou recommandations financiers, d'investissement, de trading ou autres fournis ou approuvés par TradingView. Pour en savoir plus, consultez les Conditions d'utilisation.
Clause de non-responsabilité
Les informations et publications ne sont pas destinées à être, et ne constituent pas, des conseils ou recommandations financiers, d'investissement, de trading ou autres fournis ou approuvés par TradingView. Pour en savoir plus, consultez les Conditions d'utilisation.