Long
JCP Bullish Triangle
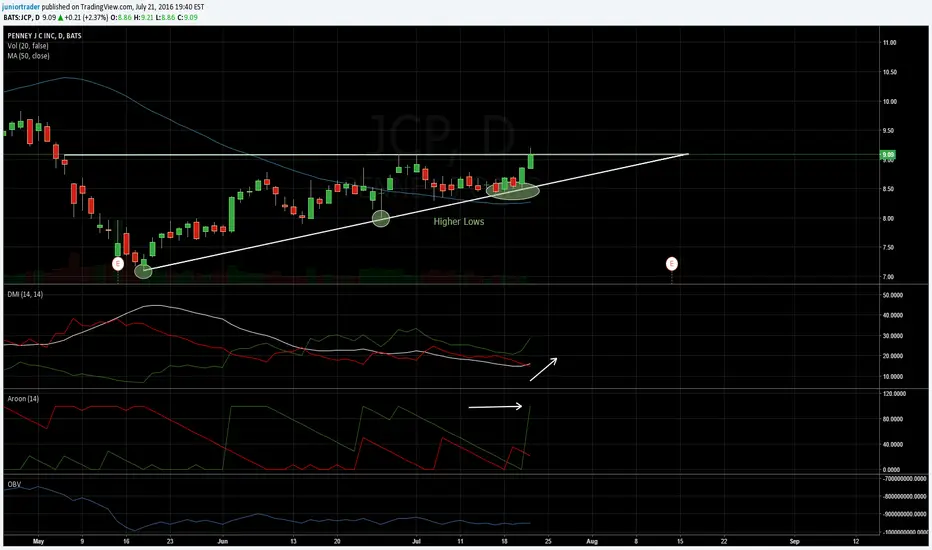
Bullish triangle on the JCP chart, watch for a breakout if the price clearly passes and closes above resistance. Chart also has clear indicators of a stong trend with the DMI showing an uptrend and the Aroon showing new uptrend. Would like to see an increase on the OBV along with the others for clarification of a strong trend though.

Clause de non-responsabilité
Les informations et publications ne sont pas destinées à être, et ne constituent pas, des conseils ou recommandations financiers, d'investissement, de trading ou autres fournis ou approuvés par TradingView. Pour en savoir plus, consultez les Conditions d'utilisation.
Clause de non-responsabilité
Les informations et publications ne sont pas destinées à être, et ne constituent pas, des conseils ou recommandations financiers, d'investissement, de trading ou autres fournis ou approuvés par TradingView. Pour en savoir plus, consultez les Conditions d'utilisation.