
I am bullish on JD in the short term based on the following:
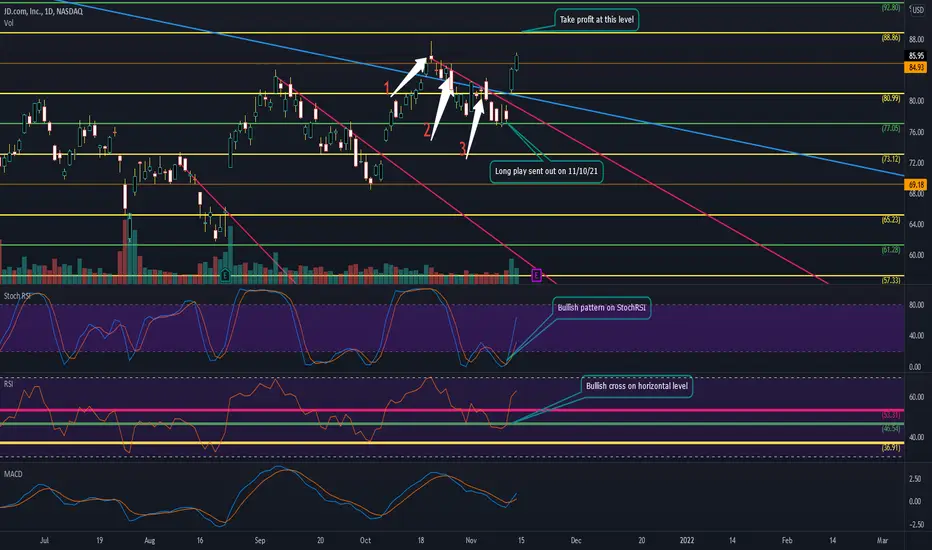
20th Oct - 8th Nov - JD had 3 waves down; and on the 8th Nov, it found support and closed above a key level. After 3 waves down, based on what I have seen, there is usually a change in direction.
9th Nov - A bullish inverted hammer candle was formed and it closed above $77.05.
10th Nov - I entered a long position based on the aforementioned items, in addition to the formation of the StochRSI and the break of the static horizontal level on RSI.
My strategy dictates, after back testing, that i take profits, four levels up from my initial entry, which will be @ $88.86.
Thank you for your time.
20th Oct - 8th Nov - JD had 3 waves down; and on the 8th Nov, it found support and closed above a key level. After 3 waves down, based on what I have seen, there is usually a change in direction.
9th Nov - A bullish inverted hammer candle was formed and it closed above $77.05.
10th Nov - I entered a long position based on the aforementioned items, in addition to the formation of the StochRSI and the break of the static horizontal level on RSI.
My strategy dictates, after back testing, that i take profits, four levels up from my initial entry, which will be @ $88.86.
Thank you for your time.
Note
Closed the trade today
Clause de non-responsabilité
Les informations et publications ne sont pas destinées à être, et ne constituent pas, des conseils ou recommandations financiers, d'investissement, de trading ou autres fournis ou approuvés par TradingView. Pour en savoir plus, consultez les Conditions d'utilisation.
Clause de non-responsabilité
Les informations et publications ne sont pas destinées à être, et ne constituent pas, des conseils ou recommandations financiers, d'investissement, de trading ou autres fournis ou approuvés par TradingView. Pour en savoir plus, consultez les Conditions d'utilisation.