

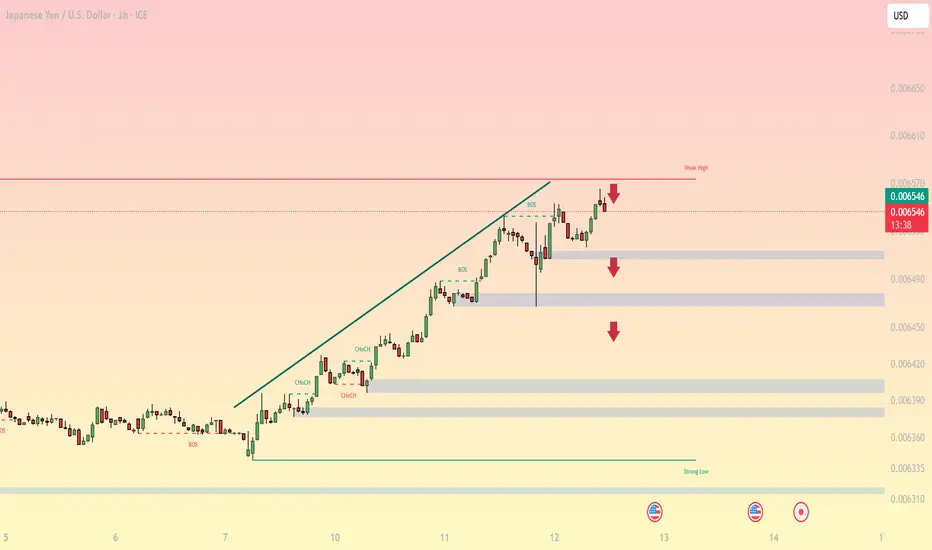
USDJPY 1H Outlook: Weak High Pressure After a Trendline Run — High-Probability Play Is a Rejection Pullback Into Demand (Levels + Fibonacci, EMA, RSI)
1H Structure Read (What’s happening now)
USDJPY has printed a clean bullish staircase with multiple BOS (Break of Structure) while respecting a rising trendline. Price is now sitting just under the marked Weak High (red horizontal line), and the latest candles show a classic “pause near the top” behavior.
At this location, the market usually does one of two things:
Rejects the Weak High and rotates down into the nearest demand shelves, or
Breaks and holds above the Weak High, then retests it as support to continue higher.
Today’s approach: trade the reaction at the Weak High instead of guessing mid-range.
Key Resistance Zones (Sell/Decision Areas)
0.00655 – 0.00656: Current intraday ceiling / local supply.
0.00657 – 0.00658: Weak High zone (liquidity target; common sweep-and-fade area).
0.00660 – 0.00662: Extension resistance (only if breakout holds).
Best short quality typically appears after a wick into 0.00657–0.00658 followed by a weak 1H close.
Key Support Zones (Downside Targets + Buyable Demand)
0.00652 – 0.00650: First pullback shelf (closest demand).
0.00648 – 0.00646: Mid demand block (stronger reaction zone).
0.00641 – 0.00640: Lower demand shelf (deeper correction target).
0.00635 – 0.00633: Strong Low region (major structural floor).
Fibonacci Map (Where Corrections Commonly Stop)
Anchor Fibonacci from the most recent swing low (start of the impulse) to the current high near the Weak High:
0.382 retracement often aligns with 0.00652–0.00650
0.5 retracement often maps into 0.00648–0.00646
0.618 retracement commonly lands near 0.00641–0.00640
Interpretation: If the Weak High rejects, the market frequently rotates into 0.5/0.618 before choosing continuation vs deeper correction.
Trendline Rules (Simple Confirmation)
Bullish continuation stays valid while price holds above the rising trendline and keeps higher lows.
A 1H close below the trendline, followed by a failed retest, is a clean trigger for a deeper pullback into the lower demand shelves.
EMA + RSI Filters (Avoid Getting Trapped)
Suggested: EMA20 / EMA50 + RSI(14)
EMA filter
In a strong uptrend, pullbacks into EMA20/EMA50 are buyable only if structure stays intact.
Short confirmation improves when price:
rejects 0.00657–0.00658, then
closes below EMA20, and
fails to reclaim EMA20/EMA50 on a retest.
RSI filter
Look for bearish divergence into the Weak High.
Continuation lower is more likely when RSI loses 50 during the rejection phase.
Trading Plans (Triggers, Stops, Targets)
Plan A: Weak High Rejection Short (Primary Setup)
Best if price sweeps the Weak High and fails.
Entry zones:
Conservative: 0.00655 – 0.00656 (first rejection)
Premium: 0.00657 – 0.00658 (Weak High sweep zone)
Stop-loss:
Above the sweep high (or above 0.00660 for premium entries)
Targets:
TP1: 0.00652 – 0.00650
TP2: 0.00648 – 0.00646
TP3: 0.00641 – 0.00640
Execution tip: take partial at TP1, move stop to breakeven once price holds below 0.00650.
Plan B: Break-and-Retest Long (Trend Continuation)
Trigger:
A clean 1H close above 0.00658, then a retest that holds 0.00657–0.00658 as support.
Entry: after retest hold
Stop-loss: below the retest low
Targets: 0.00660 – 0.00662, then 0.00665 (if expansion continues)
This avoids buying directly into supply without confirmation.
Plan C: Pullback Long Into Demand (Lower-Risk Trend Entry)
Trigger:
Price drops into 0.00648–0.00646 or 0.00641–0.00640 and prints a strong reversal candle with RSI stabilizing.
Entry: after confirmation inside demand
Stop-loss: below demand low
Targets: 0.00652 – 0.00656, then retest of 0.00657 – 0.00658
What Invalidates the Short Idea
The rejection-short setup becomes low probability if:
price breaks above 0.00658 and holds (not just wicks), and
retests 0.00657–0.00658 as support.
That signals acceptance above supply and shifts the bias back to continuation longs.
Bottom Line
USDJPY 1H remains structurally bullish, but price is pressing into a Weak High, where pullbacks commonly start. The highest-probability strategy today is reaction trading:
Short a confirmed rejection from 0.00657–0.00658 toward 0.00652 → 0.00648 → 0.00641, or
Long only after a clean break-and-retest above 0.00658.
1H Structure Read (What’s happening now)
USDJPY has printed a clean bullish staircase with multiple BOS (Break of Structure) while respecting a rising trendline. Price is now sitting just under the marked Weak High (red horizontal line), and the latest candles show a classic “pause near the top” behavior.
At this location, the market usually does one of two things:
Rejects the Weak High and rotates down into the nearest demand shelves, or
Breaks and holds above the Weak High, then retests it as support to continue higher.
Today’s approach: trade the reaction at the Weak High instead of guessing mid-range.
Key Resistance Zones (Sell/Decision Areas)
0.00655 – 0.00656: Current intraday ceiling / local supply.
0.00657 – 0.00658: Weak High zone (liquidity target; common sweep-and-fade area).
0.00660 – 0.00662: Extension resistance (only if breakout holds).
Best short quality typically appears after a wick into 0.00657–0.00658 followed by a weak 1H close.
Key Support Zones (Downside Targets + Buyable Demand)
0.00652 – 0.00650: First pullback shelf (closest demand).
0.00648 – 0.00646: Mid demand block (stronger reaction zone).
0.00641 – 0.00640: Lower demand shelf (deeper correction target).
0.00635 – 0.00633: Strong Low region (major structural floor).
Fibonacci Map (Where Corrections Commonly Stop)
Anchor Fibonacci from the most recent swing low (start of the impulse) to the current high near the Weak High:
0.382 retracement often aligns with 0.00652–0.00650
0.5 retracement often maps into 0.00648–0.00646
0.618 retracement commonly lands near 0.00641–0.00640
Interpretation: If the Weak High rejects, the market frequently rotates into 0.5/0.618 before choosing continuation vs deeper correction.
Trendline Rules (Simple Confirmation)
Bullish continuation stays valid while price holds above the rising trendline and keeps higher lows.
A 1H close below the trendline, followed by a failed retest, is a clean trigger for a deeper pullback into the lower demand shelves.
EMA + RSI Filters (Avoid Getting Trapped)
Suggested: EMA20 / EMA50 + RSI(14)
EMA filter
In a strong uptrend, pullbacks into EMA20/EMA50 are buyable only if structure stays intact.
Short confirmation improves when price:
rejects 0.00657–0.00658, then
closes below EMA20, and
fails to reclaim EMA20/EMA50 on a retest.
RSI filter
Look for bearish divergence into the Weak High.
Continuation lower is more likely when RSI loses 50 during the rejection phase.
Trading Plans (Triggers, Stops, Targets)
Plan A: Weak High Rejection Short (Primary Setup)
Best if price sweeps the Weak High and fails.
Entry zones:
Conservative: 0.00655 – 0.00656 (first rejection)
Premium: 0.00657 – 0.00658 (Weak High sweep zone)
Stop-loss:
Above the sweep high (or above 0.00660 for premium entries)
Targets:
TP1: 0.00652 – 0.00650
TP2: 0.00648 – 0.00646
TP3: 0.00641 – 0.00640
Execution tip: take partial at TP1, move stop to breakeven once price holds below 0.00650.
Plan B: Break-and-Retest Long (Trend Continuation)
Trigger:
A clean 1H close above 0.00658, then a retest that holds 0.00657–0.00658 as support.
Entry: after retest hold
Stop-loss: below the retest low
Targets: 0.00660 – 0.00662, then 0.00665 (if expansion continues)
This avoids buying directly into supply without confirmation.
Plan C: Pullback Long Into Demand (Lower-Risk Trend Entry)
Trigger:
Price drops into 0.00648–0.00646 or 0.00641–0.00640 and prints a strong reversal candle with RSI stabilizing.
Entry: after confirmation inside demand
Stop-loss: below demand low
Targets: 0.00652 – 0.00656, then retest of 0.00657 – 0.00658
What Invalidates the Short Idea
The rejection-short setup becomes low probability if:
price breaks above 0.00658 and holds (not just wicks), and
retests 0.00657–0.00658 as support.
That signals acceptance above supply and shifts the bias back to continuation longs.
Bottom Line
USDJPY 1H remains structurally bullish, but price is pressing into a Weak High, where pullbacks commonly start. The highest-probability strategy today is reaction trading:
Short a confirmed rejection from 0.00657–0.00658 toward 0.00652 → 0.00648 → 0.00641, or
Long only after a clean break-and-retest above 0.00658.

🪙 JOIN OUR FREE TELEGRAM GROUP 🪙
t.me/dnaprofits
Join the community group to get support and share knowledge!
️🥇 Exchange and learn market knowledge
️🥇 Support free trading signals
t.me/dnaprofits
Join the community group to get support and share knowledge!
️🥇 Exchange and learn market knowledge
️🥇 Support free trading signals
Clause de non-responsabilité
Les informations et publications ne sont pas destinées à être, et ne constituent pas, des conseils ou recommandations financiers, d'investissement, de trading ou autres fournis ou approuvés par TradingView. Pour en savoir plus, consultez les Conditions d'utilisation.
🪙 JOIN OUR FREE TELEGRAM GROUP 🪙
t.me/dnaprofits
Join the community group to get support and share knowledge!
️🥇 Exchange and learn market knowledge
️🥇 Support free trading signals
t.me/dnaprofits
Join the community group to get support and share knowledge!
️🥇 Exchange and learn market knowledge
️🥇 Support free trading signals
Clause de non-responsabilité
Les informations et publications ne sont pas destinées à être, et ne constituent pas, des conseils ou recommandations financiers, d'investissement, de trading ou autres fournis ou approuvés par TradingView. Pour en savoir plus, consultez les Conditions d'utilisation.