An Uptrend Pattern!
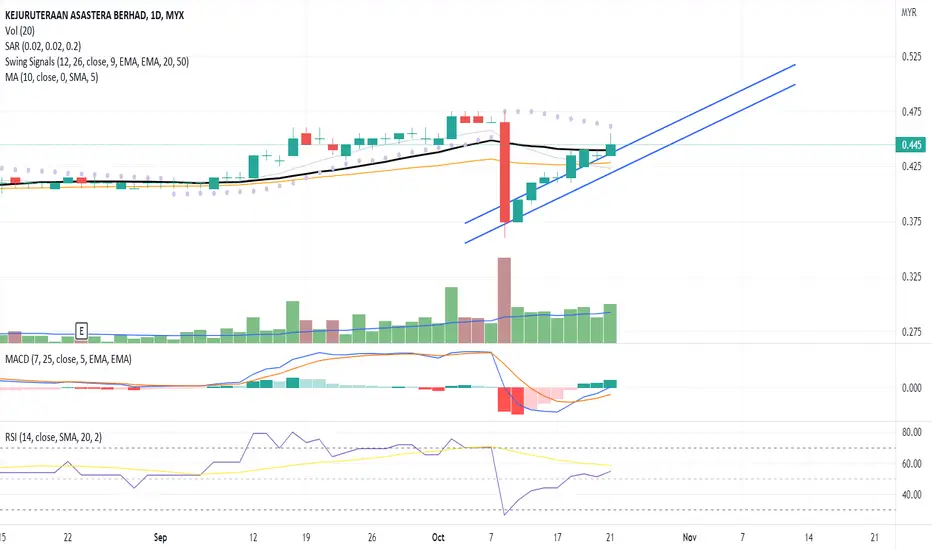
The candlestick pattern indicates a continuous price uptrend towards the MA20 line backed with high volume.
Precaution because the last candlestick indicates a "shooting star" candle, hence, the probability of price correction between the trendline channel or potential resistance area around the price range of the candle.
The MACD confirms the price uptrend towards the next price resistance.
The RSI indicates a fresh buying interest in the stock.
Let's put KAB in WL and watch out for continuous price movement toward the next price resistance backed with volume.
R 0.470
S 0.425
Precaution because the last candlestick indicates a "shooting star" candle, hence, the probability of price correction between the trendline channel or potential resistance area around the price range of the candle.
The MACD confirms the price uptrend towards the next price resistance.
The RSI indicates a fresh buying interest in the stock.
Let's put KAB in WL and watch out for continuous price movement toward the next price resistance backed with volume.
R 0.470
S 0.425

Clause de non-responsabilité
Les informations et publications ne sont pas destinées à être, et ne constituent pas, des conseils ou recommandations financiers, d'investissement, de trading ou autres fournis ou approuvés par TradingView. Pour en savoir plus, consultez les Conditions d'utilisation.
Clause de non-responsabilité
Les informations et publications ne sont pas destinées à être, et ne constituent pas, des conseils ou recommandations financiers, d'investissement, de trading ou autres fournis ou approuvés par TradingView. Pour en savoir plus, consultez les Conditions d'utilisation.