
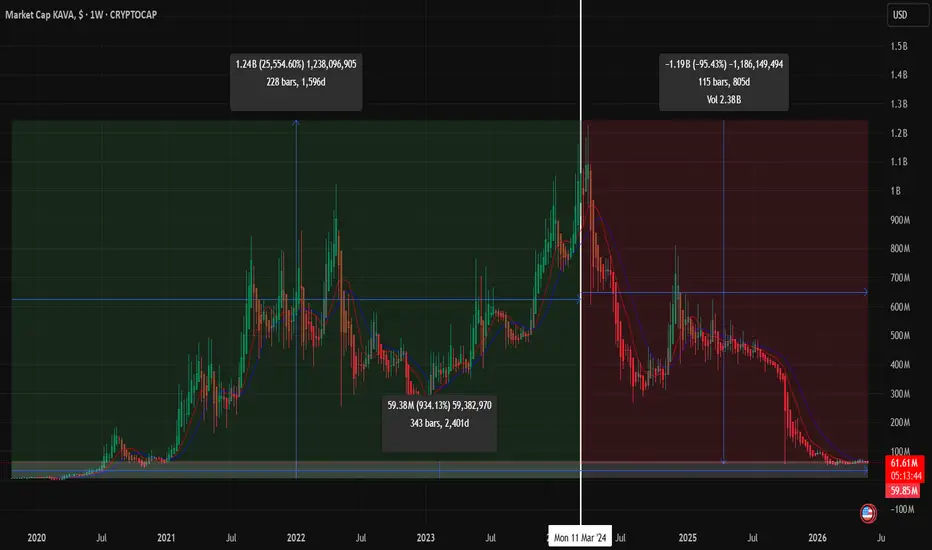
KAVA has completed one of the most dramatic boom-and-bust cycles in the crypto market.
After rallying more than 25,000% from the 2020 lows to a market cap above $1.2B, the project entered a prolonged distribution phase that ultimately erased over 95% of its value.
The weekly chart shows a clear rejection from the 2024 cycle high, followed by a decisive breakdown below the key $620M market cap level. Every recovery attempt since then has failed to reclaim former support, confirming the broader bearish structure.
Now the market cap has returned to the same region that launched the previous bull run. Volatility has collapsed, selling pressure appears exhausted, and price is consolidating near historical demand.
The key question is whether this is:
A long-term accumulation zone before the next cycle, or
Simply a pause before further downside.
Bullish Scenario
- Hold the current support zone.
- Weekly volume begins expanding.
- Market cap reclaims the $150M–$200M region.
- Eventually challenge the major resistance near $620M.
Bearish Scenario
- Loss of current support.
- Continued lack of participation and volume.
- New all-time lows and extended market cap compression.
For now, the chart suggests capitulation and stabilization, but not yet a confirmed trend reversal.
Trend: Bearish
Structure: Accumulation Attempt
Key Resistance: ~$620M Market Cap
Key Support: ~$60M Market Cap
Bias: Neutral until proven otherwise
After rallying more than 25,000% from the 2020 lows to a market cap above $1.2B, the project entered a prolonged distribution phase that ultimately erased over 95% of its value.
The weekly chart shows a clear rejection from the 2024 cycle high, followed by a decisive breakdown below the key $620M market cap level. Every recovery attempt since then has failed to reclaim former support, confirming the broader bearish structure.
Now the market cap has returned to the same region that launched the previous bull run. Volatility has collapsed, selling pressure appears exhausted, and price is consolidating near historical demand.
The key question is whether this is:
A long-term accumulation zone before the next cycle, or
Simply a pause before further downside.
Bullish Scenario
- Hold the current support zone.
- Weekly volume begins expanding.
- Market cap reclaims the $150M–$200M region.
- Eventually challenge the major resistance near $620M.
Bearish Scenario
- Loss of current support.
- Continued lack of participation and volume.
- New all-time lows and extended market cap compression.
For now, the chart suggests capitulation and stabilization, but not yet a confirmed trend reversal.
Trend: Bearish
Structure: Accumulation Attempt
Key Resistance: ~$620M Market Cap
Key Support: ~$60M Market Cap
Bias: Neutral until proven otherwise

Clause de non-responsabilité
Les informations et publications ne sont pas destinées à être, et ne constituent pas, des conseils ou recommandations financiers, d'investissement, de trading ou autres fournis ou approuvés par TradingView. Pour en savoir plus, consultez les Conditions d'utilisation.
Clause de non-responsabilité
Les informations et publications ne sont pas destinées à être, et ne constituent pas, des conseils ou recommandations financiers, d'investissement, de trading ou autres fournis ou approuvés par TradingView. Pour en savoir plus, consultez les Conditions d'utilisation.