
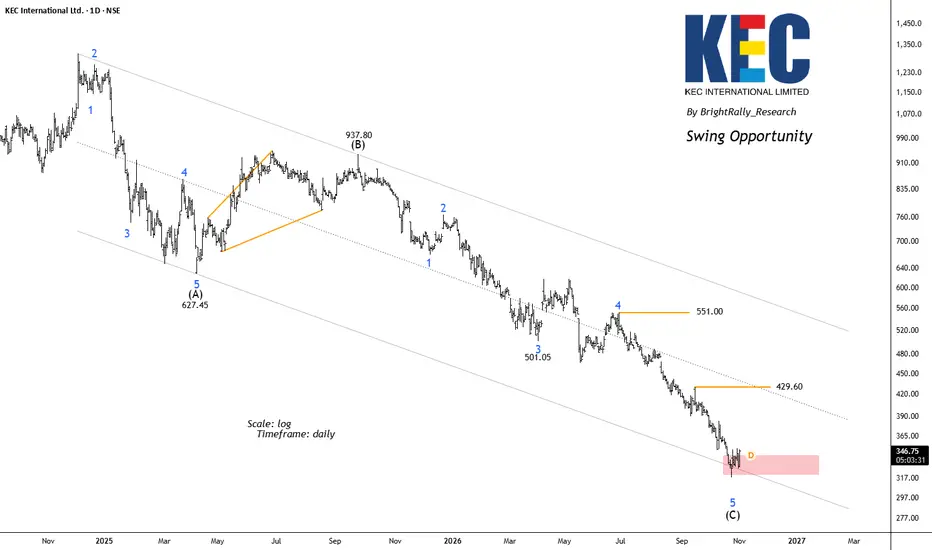
KEC International has been trading inside a broad descending channel, reflecting a prolonged corrective phase. The Elliott Wave structure suggests that the stock may be approaching the final stages of a larger Wave (C) decline.
The chart shows Wave (A) ending near ₹627.45, followed by a recovery into Wave (B) near ₹937.80. Since then, the stock has continued its downward journey in a developing Wave (C) structure.
The recent decline appears to be completing Wave 5, with the price now entering an important demand zone around ₹317.25. The latest daily candle has shown a positive move, which could indicate early buying interest.
Key levels to watch
- Immediate support: ₹317
- First resistance: ₹429.60
- Major resistance: ₹551
Swing outlook
KEC is approaching a technically important area where a relief rally or swing recovery could develop. A sustained move above ₹429.60 would strengthen the recovery scenario and bring ₹551 into focus.
However, the broader trend remains bearish, so a positive candle alone is not enough to confirm a reversal. A decisive break below ₹317.25 would weaken the bullish setup and suggest that the correction may continue.
BrightRally_Research on TradingView
The chart shows Wave (A) ending near ₹627.45, followed by a recovery into Wave (B) near ₹937.80. Since then, the stock has continued its downward journey in a developing Wave (C) structure.
The recent decline appears to be completing Wave 5, with the price now entering an important demand zone around ₹317.25. The latest daily candle has shown a positive move, which could indicate early buying interest.
Key levels to watch
- Immediate support: ₹317
- First resistance: ₹429.60
- Major resistance: ₹551
Swing outlook
KEC is approaching a technically important area where a relief rally or swing recovery could develop. A sustained move above ₹429.60 would strengthen the recovery scenario and bring ₹551 into focus.
However, the broader trend remains bearish, so a positive candle alone is not enough to confirm a reversal. A decisive break below ₹317.25 would weaken the bullish setup and suggest that the correction may continue.
BrightRally_Research on TradingView
Transaction en cours
Will update the chart when the reversal is taking place. Stay tuned!
Publications connexes
Clause de non-responsabilité
Les informations et publications ne sont pas destinées à être, et ne constituent pas, des conseils ou recommandations financiers, d'investissement, de trading ou autres fournis ou approuvés par TradingView. Pour en savoir plus, consultez les Conditions d'utilisation.
Publications connexes
Clause de non-responsabilité
Les informations et publications ne sont pas destinées à être, et ne constituent pas, des conseils ou recommandations financiers, d'investissement, de trading ou autres fournis ou approuvés par TradingView. Pour en savoir plus, consultez les Conditions d'utilisation.