
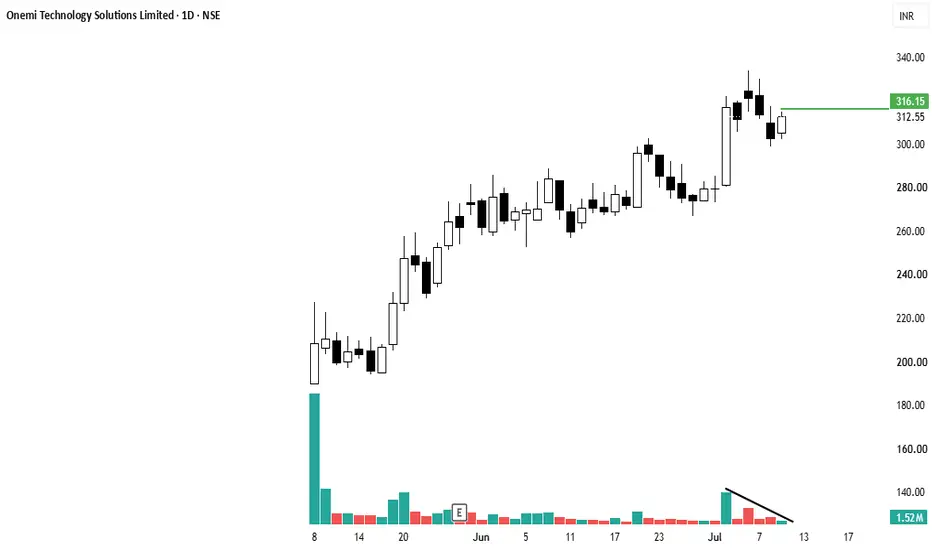
Chart Metadata & Stock Details
Stock Symbol & Exchange: Onemi Technology Solutions Limited (1D • NSE) – meaning each candlestick represents 1 day of trading activity on the National Stock Exchange of India.
Pricing Currency: INR (Indian Rupee), shown on the top right axis.
Latest Candlestick Data:
Open (O): 305.00
High (H): 315.00
Low (L): 302.20
Close (C): 312.55 (Up +9.90 or +3.27%)
Volume: 1.52M
Price Action & Trend Analysis
Strong Uptrend: The stock shows a clear, sustained bullish primary trend, moving steadily upwards from around the 190–200 level up to a recent peak near 330.
Recent Correction and Bounce: After hitting a peak in early July, the stock underwent a brief 3-day pullback (indicated by the consecutive black/filled candlesticks). The most recent candle is a white (bullish) body, showing that buyers stepped back in near the 300 level.
Resistance Level: A horizontal green line is drawn at 316.15, which marks a near-term resistance target or breakout level that the price is currently testing.
Volume Analysis
The bottom panel displays daily volume bars (green for positive days, red for negative days).
Declining Volume Trend: A black diagonal line is drawn over the recent volume bars, highlighting that trading volume significantly contracted during the recent 3-day price pullback. In technical analysis, declining volume during a retracement typically suggests low selling pressure, which favors a bullish continuation.
Stock Symbol & Exchange: Onemi Technology Solutions Limited (1D • NSE) – meaning each candlestick represents 1 day of trading activity on the National Stock Exchange of India.
Pricing Currency: INR (Indian Rupee), shown on the top right axis.
Latest Candlestick Data:
Open (O): 305.00
High (H): 315.00
Low (L): 302.20
Close (C): 312.55 (Up +9.90 or +3.27%)
Volume: 1.52M
Price Action & Trend Analysis
Strong Uptrend: The stock shows a clear, sustained bullish primary trend, moving steadily upwards from around the 190–200 level up to a recent peak near 330.
Recent Correction and Bounce: After hitting a peak in early July, the stock underwent a brief 3-day pullback (indicated by the consecutive black/filled candlesticks). The most recent candle is a white (bullish) body, showing that buyers stepped back in near the 300 level.
Resistance Level: A horizontal green line is drawn at 316.15, which marks a near-term resistance target or breakout level that the price is currently testing.
Volume Analysis
The bottom panel displays daily volume bars (green for positive days, red for negative days).
Declining Volume Trend: A black diagonal line is drawn over the recent volume bars, highlighting that trading volume significantly contracted during the recent 3-day price pullback. In technical analysis, declining volume during a retracement typically suggests low selling pressure, which favors a bullish continuation.
Transaction en cours

Clause de non-responsabilité
Les informations et publications ne sont pas destinées à être, et ne constituent pas, des conseils ou recommandations financiers, d'investissement, de trading ou autres fournis ou approuvés par TradingView. Pour en savoir plus, consultez les Conditions d'utilisation.
Clause de non-responsabilité
Les informations et publications ne sont pas destinées à être, et ne constituent pas, des conseils ou recommandations financiers, d'investissement, de trading ou autres fournis ou approuvés par TradingView. Pour en savoir plus, consultez les Conditions d'utilisation.