Mis à jour
LINA Analysis (4H)
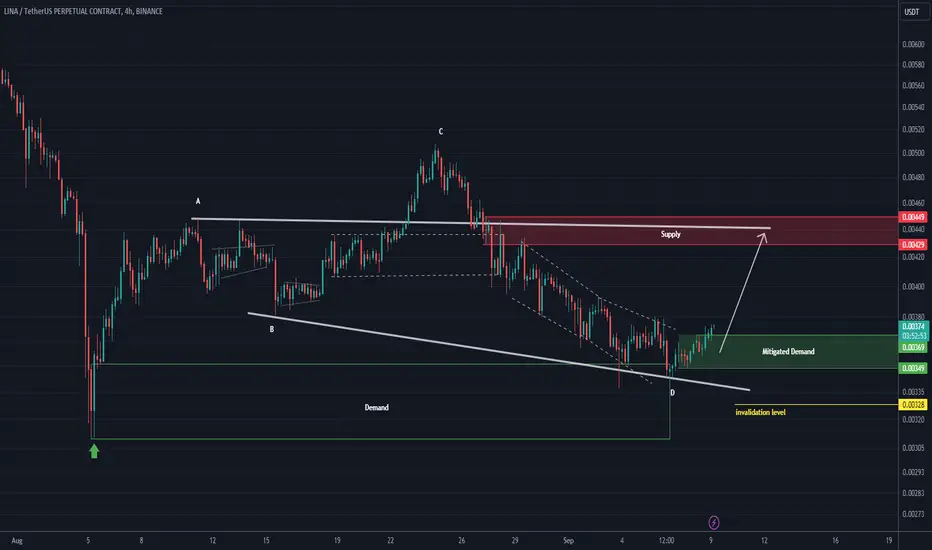
It looks like a bullish pattern has formed from where we placed the green arrow on the chart.
So far, by the data available from this pattern, it appears to be a triangle.
Wave D is over and price is forming wave E.
It is expected to move towards the red range while maintaining the green range.
Closing a daily candle below the invalidation level will violate the analysis.
For risk management, please don't forget stop loss and capital management
Comment if you have any questions
Thank You
Trade fermée: cible de profit atteinte
By hitting the green box, it was pumped more than 16% and reached the red box
🔥 Don't Just Watch the Market. Understand It!
📊 Crypto Analysis & Setups:
👉 t.me/Behdark_EN
💹 Forex Analysis & Setups:
👉 t.me/FX_Behdark
🚀 Join BehDark for Market Insights, Trading Setups & Key Levels. Choose Your Market & Join Us!
📊 Crypto Analysis & Setups:
👉 t.me/Behdark_EN
💹 Forex Analysis & Setups:
👉 t.me/FX_Behdark
🚀 Join BehDark for Market Insights, Trading Setups & Key Levels. Choose Your Market & Join Us!
Clause de non-responsabilité
Les informations et publications ne sont pas destinées à être, et ne constituent pas, des conseils ou recommandations financiers, d'investissement, de trading ou autres fournis ou approuvés par TradingView. Pour en savoir plus, consultez les Conditions d'utilisation.