
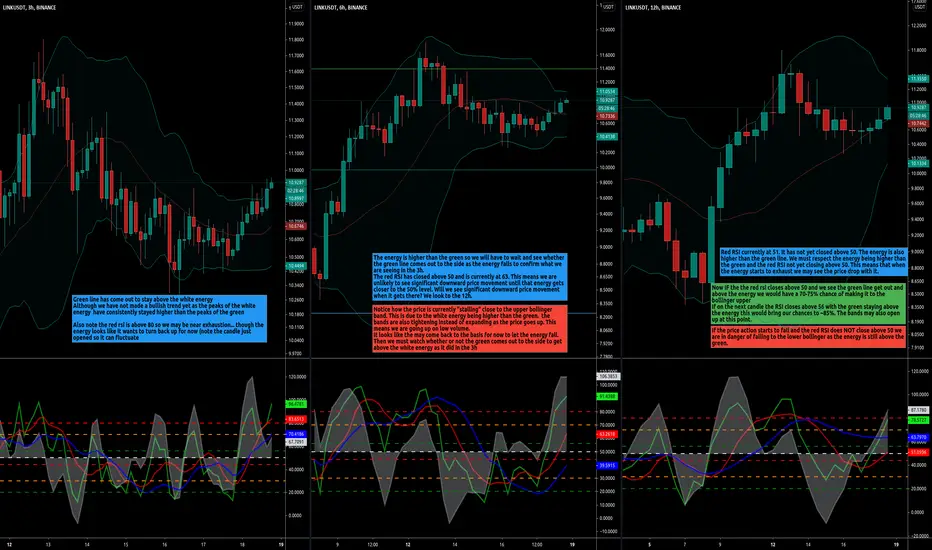
For now it looks like we must watch to see whether the green line comes out to the side in the 6h and if the red RSI can close above 50 in the 12h.
Note
Note
This chart is the same chart as posted in the idea, just you are able to click on it so you can read the text bubbles and zoom in accordinglyPlease like the idea and comment below any thoughts you may have. I would greatly appreciate it, thanks!
Note
Small update since we have new 90m and 3h candles.
Note: as I was typing out the text bubbles the price dropped. The wick down was just a big market sell on binance as it jumped back up in milliseconds.
Note
Here is an update with the new candles.
A lot of where the price action goes is going to depend on where that red RSI in the 12h goes in the next candle.

Clause de non-responsabilité
Les informations et publications ne sont pas destinées à être, et ne constituent pas, des conseils ou recommandations financiers, d'investissement, de trading ou autres fournis ou approuvés par TradingView. Pour en savoir plus, consultez les Conditions d'utilisation.
Clause de non-responsabilité
Les informations et publications ne sont pas destinées à être, et ne constituent pas, des conseils ou recommandations financiers, d'investissement, de trading ou autres fournis ou approuvés par TradingView. Pour en savoir plus, consultez les Conditions d'utilisation.