
📊
1. MARKET STRUCTURE
Long-term trend
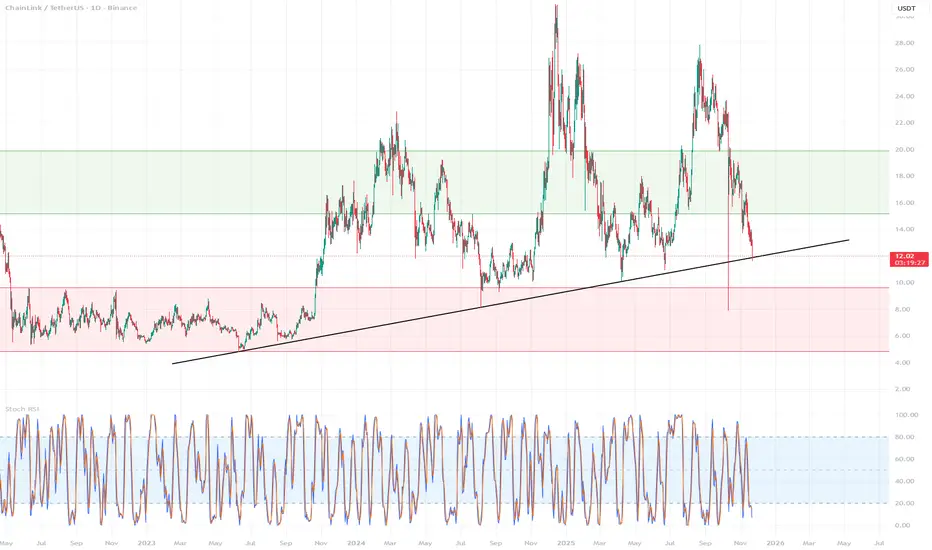
The price is currently approaching this line, but has not yet tested it directly.
This is a key support level for the entire LINK market.
2. SUPPLY & DEMAND ZONE
Demand Zone — $9.6 – $4.8
The large red area. This is
a historical accumulation zone,
an area where LINK has been repeatedly defended,
an area to which the price has returned with each major dump.
Supply Zone — $15 – $20
The green area from which:
the price has been rejected repeatedly,
this is the selling wall from 2021,
a key target for bulls after the rebound.
3. CRITICAL LEVELS
Very important support
Type Level Description
Trendline ~11.5–12.2 USD We are very close to a test.
Horizontal 9.63 USD First major historical support.
Horizontal 4.84 USD Final low (strongest demand).
If the trendline breaks, the → ** LINK will almost certainly fall to 9.63**, and if that breaks too, → 4.8 USD is very likely.
4. MOMENTUM – STOCH RSI
On the Stoch RSI chart:
is extremely oversold,
similar to previous lows (2023, 2024),
signaling the possibility of a rebound within a few days/weeks.
5. PRICE SCENARIOS
🟢 BULLISH (bounce)
Condition: Maintaining the trendline
Expected movements:
Bounce around 11.5–12.5
Target 1: USD 15
Target 2: USD 18–20
Possible breakout → USD 22–24
This scenario is realistic if Bitcoin doesn't make another strong dump.
🔴 BEARISH (falling)
Condition: Breakout of the trendline with a daily candle below ~11.5
Expected movements:
A quick drop to USD 9.63
This could result in:
a bounce to ~12
or a continuation of the decline
If 9.63 falls → a practically certain target of USD 4.8
This level represents a significant historical accumulation and will not fall without a fight.
➤ Price is currently hanging by a thread.
The trendline is one of the most important support levels on the LINK chart.
Momentum is oversold → signal for a short squeeze/bounce.
But the local structure remains bearish.
➤ If the trendline holds → a thick long swing.
➤ If it collapses → we fall to 9.63 and possibly 4.8.
1. MARKET STRUCTURE
Long-term trend
The price is currently approaching this line, but has not yet tested it directly.
This is a key support level for the entire LINK market.
2. SUPPLY & DEMAND ZONE
Demand Zone — $9.6 – $4.8
The large red area. This is
a historical accumulation zone,
an area where LINK has been repeatedly defended,
an area to which the price has returned with each major dump.
Supply Zone — $15 – $20
The green area from which:
the price has been rejected repeatedly,
this is the selling wall from 2021,
a key target for bulls after the rebound.
3. CRITICAL LEVELS
Very important support
Type Level Description
Trendline ~11.5–12.2 USD We are very close to a test.
Horizontal 9.63 USD First major historical support.
Horizontal 4.84 USD Final low (strongest demand).
If the trendline breaks, the → ** LINK will almost certainly fall to 9.63**, and if that breaks too, → 4.8 USD is very likely.
4. MOMENTUM – STOCH RSI
On the Stoch RSI chart:
is extremely oversold,
similar to previous lows (2023, 2024),
signaling the possibility of a rebound within a few days/weeks.
5. PRICE SCENARIOS
🟢 BULLISH (bounce)
Condition: Maintaining the trendline
Expected movements:
Bounce around 11.5–12.5
Target 1: USD 15
Target 2: USD 18–20
Possible breakout → USD 22–24
This scenario is realistic if Bitcoin doesn't make another strong dump.
🔴 BEARISH (falling)
Condition: Breakout of the trendline with a daily candle below ~11.5
Expected movements:
A quick drop to USD 9.63
This could result in:
a bounce to ~12
or a continuation of the decline
If 9.63 falls → a practically certain target of USD 4.8
This level represents a significant historical accumulation and will not fall without a fight.
➤ Price is currently hanging by a thread.
The trendline is one of the most important support levels on the LINK chart.
Momentum is oversold → signal for a short squeeze/bounce.
But the local structure remains bearish.
➤ If the trendline holds → a thick long swing.
➤ If it collapses → we fall to 9.63 and possibly 4.8.

Clause de non-responsabilité
Les informations et publications ne sont pas destinées à être, et ne constituent pas, des conseils ou recommandations financiers, d'investissement, de trading ou autres fournis ou approuvés par TradingView. Pour en savoir plus, consultez les Conditions d'utilisation.
Clause de non-responsabilité
Les informations et publications ne sont pas destinées à être, et ne constituent pas, des conseils ou recommandations financiers, d'investissement, de trading ou autres fournis ou approuvés par TradingView. Pour en savoir plus, consultez les Conditions d'utilisation.