Long
LRCUSDT - Dailly analysis
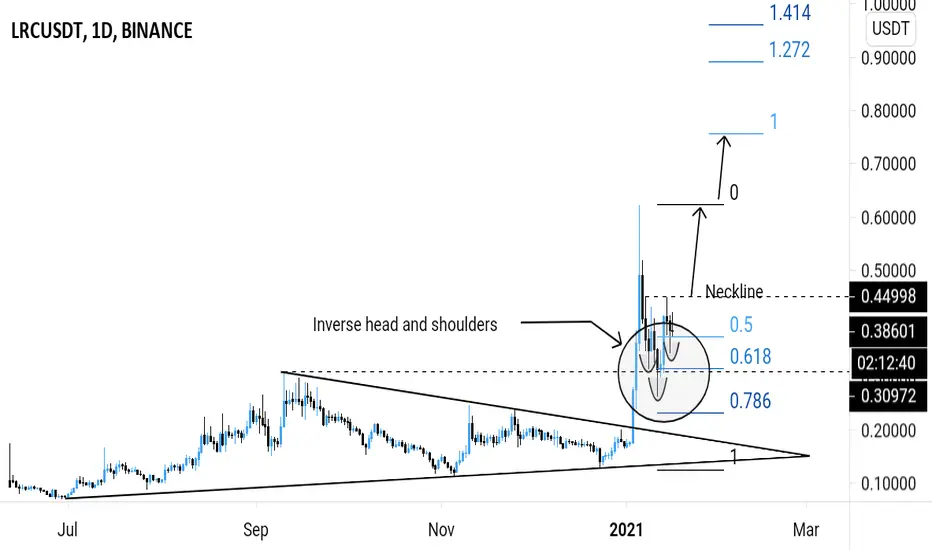
LRCUSDT brokeout above the symmetrical triangle pattern as expected from my previous analysis.
Price hit the ATH and retraced.
Price is testing the flip horizontal support + 0.618 fibonacci retracement level.
A bullish pin bar ( hammer ) was formed on the Daily timeframe.
Price action is printing the inverse head and shoulders reversal pattern.
Possible uptrend continuation.
Buy entry ⬆️ - breakout above the inverse head and shoulders neckline resistance.
Targets 🎯 - previous swing high (ATH), fibonacci extension levels.
Setup invalidation ❌ - breakdown below the inverse shoulders support level.
Price hit the ATH and retraced.
Price is testing the flip horizontal support + 0.618 fibonacci retracement level.
A bullish pin bar ( hammer ) was formed on the Daily timeframe.
Price action is printing the inverse head and shoulders reversal pattern.
Possible uptrend continuation.
Buy entry ⬆️ - breakout above the inverse head and shoulders neckline resistance.
Targets 🎯 - previous swing high (ATH), fibonacci extension levels.
Setup invalidation ❌ - breakdown below the inverse shoulders support level.

Publications connexes
Clause de non-responsabilité
Les informations et publications ne sont pas destinées à être, et ne constituent pas, des conseils ou recommandations financiers, d'investissement, de trading ou autres fournis ou approuvés par TradingView. Pour en savoir plus, consultez les Conditions d'utilisation.
Publications connexes
Clause de non-responsabilité
Les informations et publications ne sont pas destinées à être, et ne constituent pas, des conseils ou recommandations financiers, d'investissement, de trading ou autres fournis ou approuvés par TradingView. Pour en savoir plus, consultez les Conditions d'utilisation.