Long
LISK GOES UP
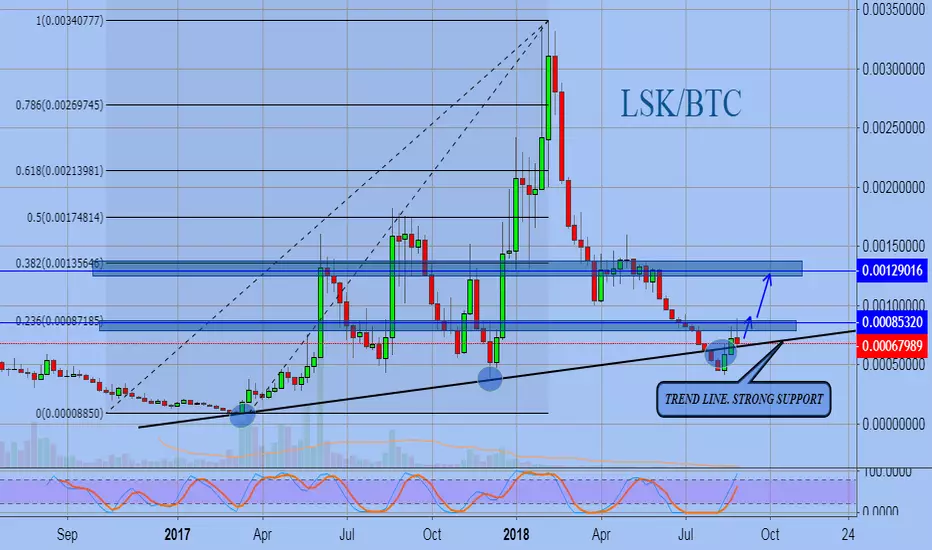
LISK is at the trend line, the chart shows the areas of contact of the support line. During the last touch, the trend line broke through, but the asset quickly returned to the growth zone.
Now the LISK is testing the support line, and then, with a high probability, it has grown at least to the 0.236 and 0.382 of the last asset growth.
Zone of resistance indicated.
Take profit - blue horizontal line
Now the LISK is testing the support line, and then, with a high probability, it has grown at least to the 0.236 and 0.382 of the last asset growth.
Zone of resistance indicated.
Take profit - blue horizontal line

Clause de non-responsabilité
Les informations et publications ne sont pas destinées à être, et ne constituent pas, des conseils ou recommandations financiers, d'investissement, de trading ou autres fournis ou approuvés par TradingView. Pour en savoir plus, consultez les Conditions d'utilisation.
Clause de non-responsabilité
Les informations et publications ne sont pas destinées à être, et ne constituent pas, des conseils ou recommandations financiers, d'investissement, de trading ou autres fournis ou approuvés par TradingView. Pour en savoir plus, consultez les Conditions d'utilisation.