
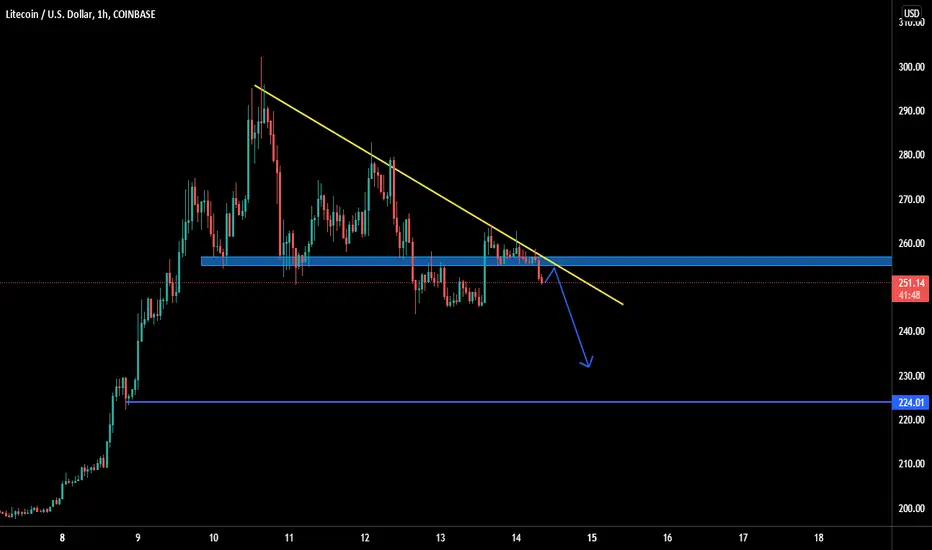
A descending triangle is a bearish chart pattern used in technical analysis that is created by drawing one trend line that connects a series of lower highs and a second horizontal trend line that connects a series of lows. Oftentimes, traders watch for a move below the lower support trend line because it suggests that the downward momentum is building and a breakdown is imminent. Once the breakdown occurs, traders enter into short positions and aggressively help push the price of the asset even lower.
KEY TAKEAWAYS
1. A descending triangle is a signal for traders to take a short position to accelerate a breakdown.
2. A descending triangle is detectable by drawing trend lines for the highs and lows on a chart.
3. A descending triangle is the counterpart of an ascending triangle, which is another trend line-based chart pattern used by technical analysts.
KEY TAKEAWAYS
1. A descending triangle is a signal for traders to take a short position to accelerate a breakdown.
2. A descending triangle is detectable by drawing trend lines for the highs and lows on a chart.
3. A descending triangle is the counterpart of an ascending triangle, which is another trend line-based chart pattern used by technical analysts.

Clause de non-responsabilité
Les informations et publications ne sont pas destinées à être, et ne constituent pas, des conseils ou recommandations financiers, d'investissement, de trading ou autres fournis ou approuvés par TradingView. Pour en savoir plus, consultez les Conditions d'utilisation.
Clause de non-responsabilité
Les informations et publications ne sont pas destinées à être, et ne constituent pas, des conseils ou recommandations financiers, d'investissement, de trading ou autres fournis ou approuvés par TradingView. Pour en savoir plus, consultez les Conditions d'utilisation.