
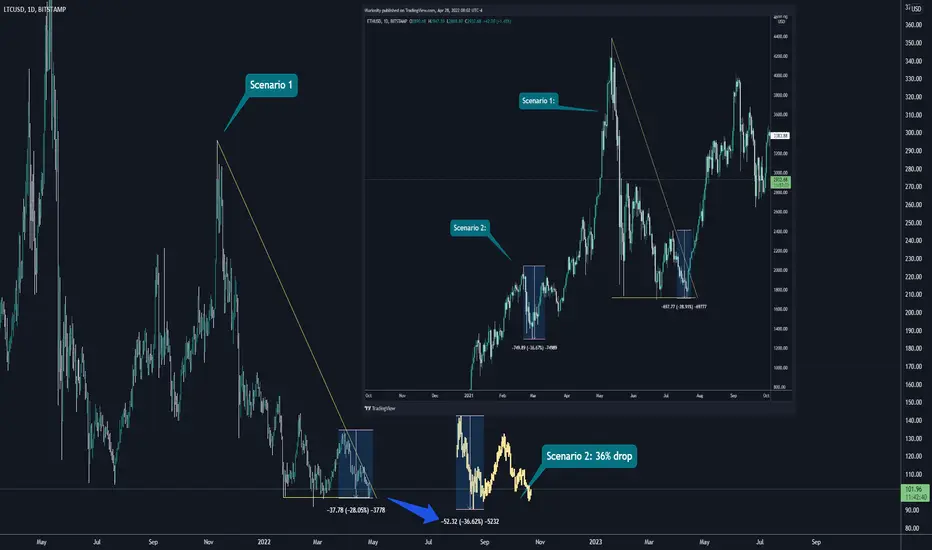
These are 2 possible scenarios with LTC that I managed to create with similar structure patterns found from ETH.
Scenario 1: was the first connection I found - where the trendline meets at the bottom 3 wicks at the bottom of the correction:
- the 28% drop towards the end of the trendline before liftoff
-same is shown with LTC currently
Scenario 2: was something else I found due to the similar patterns ETH had shown before its leg up:
- a 36% drop to its bottom before the leg up
- same can is shown with LTC currently
this isn't financial advice, just a chart full of hopium xD
Scenario 1: was the first connection I found - where the trendline meets at the bottom 3 wicks at the bottom of the correction:
- the 28% drop towards the end of the trendline before liftoff
-same is shown with LTC currently
Scenario 2: was something else I found due to the similar patterns ETH had shown before its leg up:
- a 36% drop to its bottom before the leg up
- same can is shown with LTC currently
this isn't financial advice, just a chart full of hopium xD

Clause de non-responsabilité
Les informations et publications ne sont pas destinées à être, et ne constituent pas, des conseils ou recommandations financiers, d'investissement, de trading ou autres fournis ou approuvés par TradingView. Pour en savoir plus, consultez les Conditions d'utilisation.
Clause de non-responsabilité
Les informations et publications ne sont pas destinées à être, et ne constituent pas, des conseils ou recommandations financiers, d'investissement, de trading ou autres fournis ou approuvés par TradingView. Pour en savoir plus, consultez les Conditions d'utilisation.