
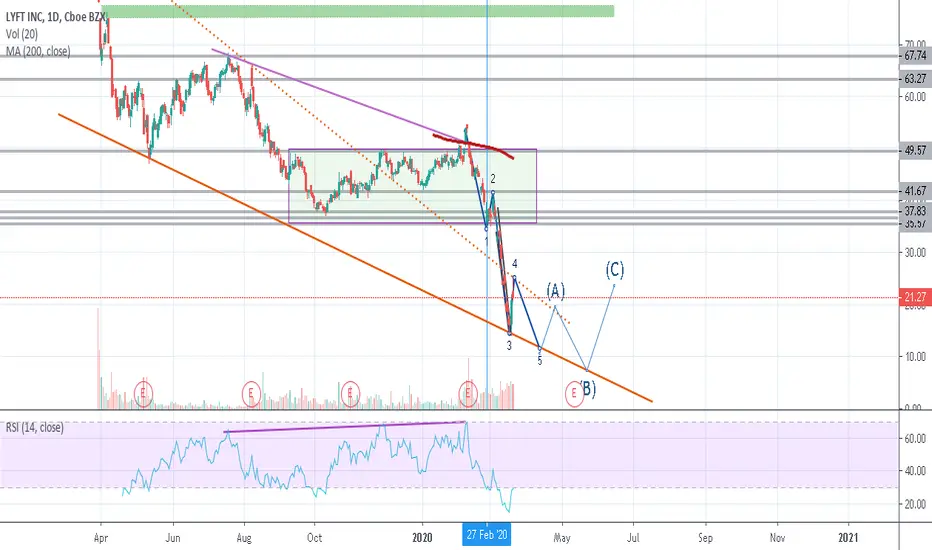
We can see in 1 day chart of Lyft stock the forming of an elliot wave in the downtrent direction and the possible areas of the ABC corrective pattern.
The downtrend was also confirmed by the hidden divergence we can see in the chart with purple lines.
The downtrend was also confirmed by the hidden divergence we can see in the chart with purple lines.

Clause de non-responsabilité
Les informations et publications ne sont pas destinées à être, et ne constituent pas, des conseils ou recommandations financiers, d'investissement, de trading ou autres fournis ou approuvés par TradingView. Pour en savoir plus, consultez les Conditions d'utilisation.
Clause de non-responsabilité
Les informations et publications ne sont pas destinées à être, et ne constituent pas, des conseils ou recommandations financiers, d'investissement, de trading ou autres fournis ou approuvés par TradingView. Pour en savoir plus, consultez les Conditions d'utilisation.