
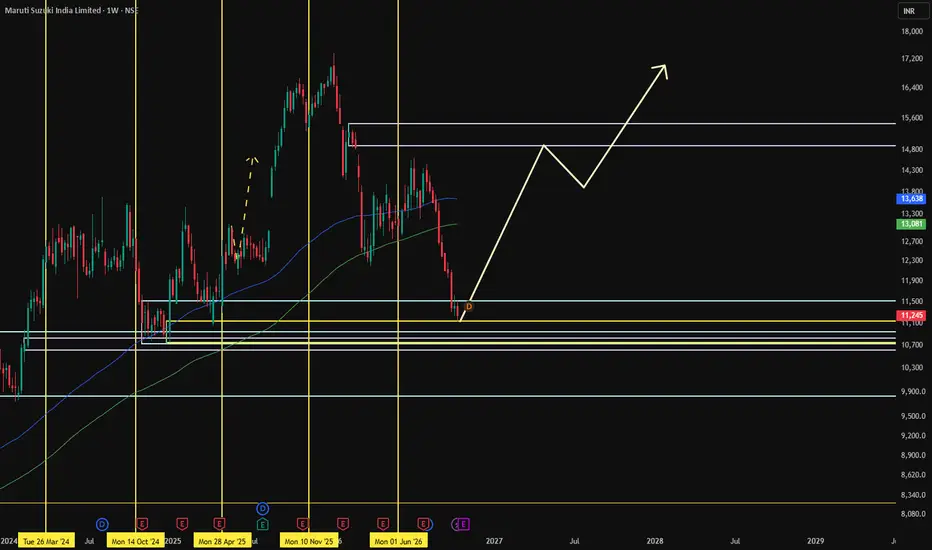
below is the detailed Maruti demand-zone setup across HTF, MTF and ITF, including proximal/distal levels, zone averages, trend, price-action logic and trade execution.
Maruti — Multi-Timeframe Demand Map
1. HTF — Higher-timeframe demand zones
Strategic demand | Yearly, half-yearly and quarterly
Yearly demand
UP
₹9,737 – ₹13,680
Average: ₹11,709 · Rally–Base–Rally
Proximal (upper)
₹13,680
Distal (lower)
₹9,737
Broad strategic zone; the wide range makes confirmation important before entry.
Half-yearly demand
UP
₹12,225 – ₹13,461
Average: ₹12,843 · Rally–Base–Rally
Shared zone with quarterly demand: ₹12,225–₹13,461.
Quarterly demand — BUFL
UP
₹10,725 – ₹13,461
Average: ₹12,093 · DMIP designation in your model
This zone overlaps the half-yearly zone at the top and extends lower to ₹10,725.
HTF takeaway: Your higher-timeframe model remains bullish, with the strongest direct overlap between half-yearly and quarterly demand at ₹12,225–₹13,461. These are broad strategic zones, not automatic entry signals.
2. MTF — Monthly, weekly and daily demand zones
Monthly demand
UP
₹10,725 – ₹11,518
Average: ₹11,122 · DMIP
Main monthly demand reference.
Weekly demand
UP
₹10,725 – ₹11,133
Average: ₹10,929 · DMIP
Overlaps the monthly zone across ₹10,725–₹11,133.
Daily demand
UP
₹10,600 – ₹10,830
Average: ₹10,715 · DMIP
Lower tactical demand zone, also used by all three intraday timeframes.
MTF demand interpretation
- ₹11,133–₹11,518: Upper monthly demand region. A reclaim and hold would be a constructive sign.
- ₹10,725–₹11,133: Main monthly/weekly overlap and an important support area.
- ₹10,600–₹10,830: Daily demand cluster and the lower area of your proposed entries.
- Below ₹10,600: Your planned stop-loss boundary is breached; the proposed trade should not be treated as intact.
3. ITF — Intraday demand zones
Timeframe Proximal Distal Average
240-minute ₹10,830 ₹10,600 ₹10,715
180-minute ₹10,830 ₹10,600 ₹10,715
60-minute ₹10,830 ₹10,600 ₹10,715
ITF average ₹10,830 ₹10,600 ₹10,715
All three zones are identical in your data. This provides a common execution reference, but it should not automatically be counted as three independent confirmations.
Confirmation to watch for: a liquidity sweep, bullish break of structure, strong buying response and a successful retest within the zone. Your supplied figures do not include candle or volume data to verify these signals.
4. Combined demand-zone hierarchy
Demand-zone ladder
Levels arranged from higher price to lower price; not to scale.
HTF overlap
Half-yearly + quarterly
₹12,225–₹13,461
Monthly upper zone
Monthly demand
₹11,133–₹11,518
MTF confluence
Monthly + weekly overlap
₹10,725–₹11,133
Daily + ITF
Daily + 240m + 180m + 60m
₹10,600–₹10,830
Yearly lower boundary
Yearly distal boundary
₹9,737
The bars indicate hierarchy only, not demand strength or probability.
5. Trade setup aligned to demand
Trade parameter Your setup
Entry 1 ₹11,200
Entry 2 ₹10,830
Average entry ₹11,015
Stop-loss ₹10,600
Target ₹14,413
Quantity 400 shares
Gross risk ₹1,66,000
Gross reward ₹13,59,200
Gross RR 8.19:1
Important: Entry 1 at ₹11,200 is within the monthly demand zone. Entry 2 at ₹10,830 sits at the upper boundary of daily and intraday demand. The ₹10,600 stop-loss is the distal boundary of those lower-timeframe zones.
The average entry assumes equal quantities at both prices. If the second entry is not filled, the average entry and risk/reward change.
Final assessment
The strongest feature in your setup is the alignment of monthly, weekly, daily and intraday demand around ₹10,600–₹11,133. The higher-timeframe structure adds broader context, but the trade needs actual price-action confirmation before being considered a validated bullish entry.
Maruti — Multi-Timeframe Demand Map
1. HTF — Higher-timeframe demand zones
Strategic demand | Yearly, half-yearly and quarterly
Yearly demand
UP
₹9,737 – ₹13,680
Average: ₹11,709 · Rally–Base–Rally
Proximal (upper)
₹13,680
Distal (lower)
₹9,737
Broad strategic zone; the wide range makes confirmation important before entry.
Half-yearly demand
UP
₹12,225 – ₹13,461
Average: ₹12,843 · Rally–Base–Rally
Shared zone with quarterly demand: ₹12,225–₹13,461.
Quarterly demand — BUFL
UP
₹10,725 – ₹13,461
Average: ₹12,093 · DMIP designation in your model
This zone overlaps the half-yearly zone at the top and extends lower to ₹10,725.
HTF takeaway: Your higher-timeframe model remains bullish, with the strongest direct overlap between half-yearly and quarterly demand at ₹12,225–₹13,461. These are broad strategic zones, not automatic entry signals.
2. MTF — Monthly, weekly and daily demand zones
Monthly demand
UP
₹10,725 – ₹11,518
Average: ₹11,122 · DMIP
Main monthly demand reference.
Weekly demand
UP
₹10,725 – ₹11,133
Average: ₹10,929 · DMIP
Overlaps the monthly zone across ₹10,725–₹11,133.
Daily demand
UP
₹10,600 – ₹10,830
Average: ₹10,715 · DMIP
Lower tactical demand zone, also used by all three intraday timeframes.
MTF demand interpretation
- ₹11,133–₹11,518: Upper monthly demand region. A reclaim and hold would be a constructive sign.
- ₹10,725–₹11,133: Main monthly/weekly overlap and an important support area.
- ₹10,600–₹10,830: Daily demand cluster and the lower area of your proposed entries.
- Below ₹10,600: Your planned stop-loss boundary is breached; the proposed trade should not be treated as intact.
3. ITF — Intraday demand zones
Timeframe Proximal Distal Average
240-minute ₹10,830 ₹10,600 ₹10,715
180-minute ₹10,830 ₹10,600 ₹10,715
60-minute ₹10,830 ₹10,600 ₹10,715
ITF average ₹10,830 ₹10,600 ₹10,715
All three zones are identical in your data. This provides a common execution reference, but it should not automatically be counted as three independent confirmations.
Confirmation to watch for: a liquidity sweep, bullish break of structure, strong buying response and a successful retest within the zone. Your supplied figures do not include candle or volume data to verify these signals.
4. Combined demand-zone hierarchy
Demand-zone ladder
Levels arranged from higher price to lower price; not to scale.
HTF overlap
Half-yearly + quarterly
₹12,225–₹13,461
Monthly upper zone
Monthly demand
₹11,133–₹11,518
MTF confluence
Monthly + weekly overlap
₹10,725–₹11,133
Daily + ITF
Daily + 240m + 180m + 60m
₹10,600–₹10,830
Yearly lower boundary
Yearly distal boundary
₹9,737
The bars indicate hierarchy only, not demand strength or probability.
5. Trade setup aligned to demand
Trade parameter Your setup
Entry 1 ₹11,200
Entry 2 ₹10,830
Average entry ₹11,015
Stop-loss ₹10,600
Target ₹14,413
Quantity 400 shares
Gross risk ₹1,66,000
Gross reward ₹13,59,200
Gross RR 8.19:1
Important: Entry 1 at ₹11,200 is within the monthly demand zone. Entry 2 at ₹10,830 sits at the upper boundary of daily and intraday demand. The ₹10,600 stop-loss is the distal boundary of those lower-timeframe zones.
The average entry assumes equal quantities at both prices. If the second entry is not filled, the average entry and risk/reward change.
Final assessment
The strongest feature in your setup is the alignment of monthly, weekly, daily and intraday demand around ₹10,600–₹11,133. The higher-timeframe structure adds broader context, but the trade needs actual price-action confirmation before being considered a validated bullish entry.

Clause de non-responsabilité
Les informations et publications ne sont pas destinées à être, et ne constituent pas, des conseils ou recommandations financiers, d'investissement, de trading ou autres fournis ou approuvés par TradingView. Pour en savoir plus, consultez les Conditions d'utilisation.
Clause de non-responsabilité
Les informations et publications ne sont pas destinées à être, et ne constituent pas, des conseils ou recommandations financiers, d'investissement, de trading ou autres fournis ou approuvés par TradingView. Pour en savoir plus, consultez les Conditions d'utilisation.