MATIC/BTC 1D Short Term
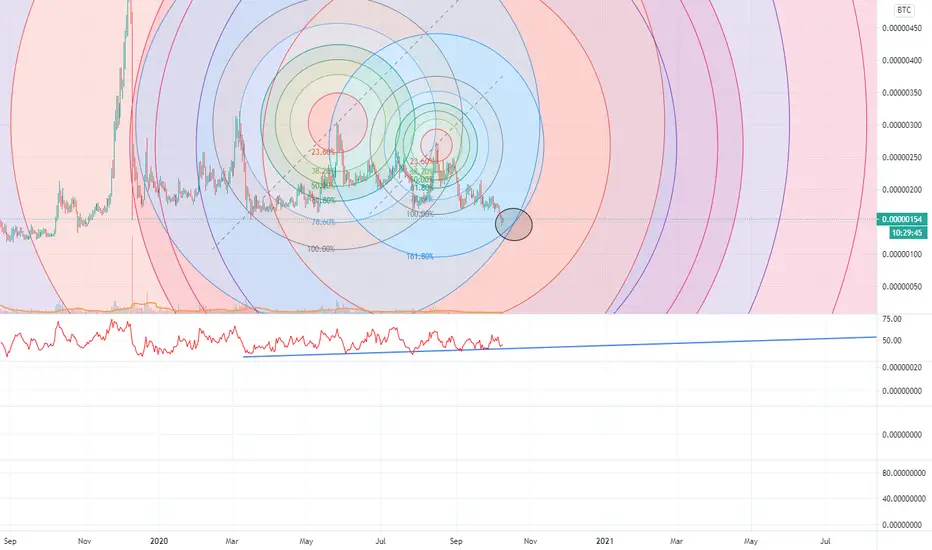
Short term we will drop to 140 sat area, see dark circle that indicates a support/resistance area. After that a rise is possible back to 170 sat area for the first target.
Also see the ultimate oscillator here. The line below the indicator indicates a last drop back to the line, before rising again.
No advice from me, i just look at the charts :)
Also see the ultimate oscillator here. The line below the indicator indicates a last drop back to the line, before rising again.
No advice from me, i just look at the charts :)

Clause de non-responsabilité
Les informations et publications ne sont pas destinées à être, et ne constituent pas, des conseils ou recommandations financiers, d'investissement, de trading ou autres fournis ou approuvés par TradingView. Pour en savoir plus, consultez les Conditions d'utilisation.
Clause de non-responsabilité
Les informations et publications ne sont pas destinées à être, et ne constituent pas, des conseils ou recommandations financiers, d'investissement, de trading ou autres fournis ou approuvés par TradingView. Pour en savoir plus, consultez les Conditions d'utilisation.