Long
MATICUSDT
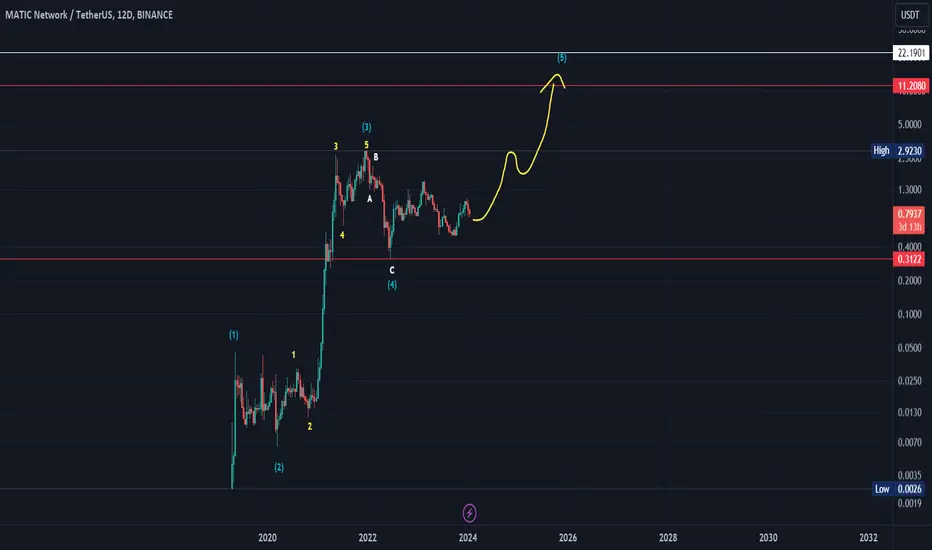
From the data shown on the chart, we find that as long as the currency does not break the bottom of the area 0.5 usdt , this indicates the accumulation of a new wave of payment, in addition to the fact that the currency against Bitcoin has been going sideways for 31 monthly candles, and this indicates the upcoming stages of accumulation and a calming of the previous indicators of inflation.
All data on the chart.. Good luck
All data on the chart.. Good luck
Ordre annulé

Clause de non-responsabilité
Les informations et publications ne sont pas destinées à être, et ne constituent pas, des conseils ou recommandations financiers, d'investissement, de trading ou autres fournis ou approuvés par TradingView. Pour en savoir plus, consultez les Conditions d'utilisation.
Clause de non-responsabilité
Les informations et publications ne sont pas destinées à être, et ne constituent pas, des conseils ou recommandations financiers, d'investissement, de trading ou autres fournis ou approuvés par TradingView. Pour en savoir plus, consultez les Conditions d'utilisation.