Short
MATIC Bearish Chart Pattern
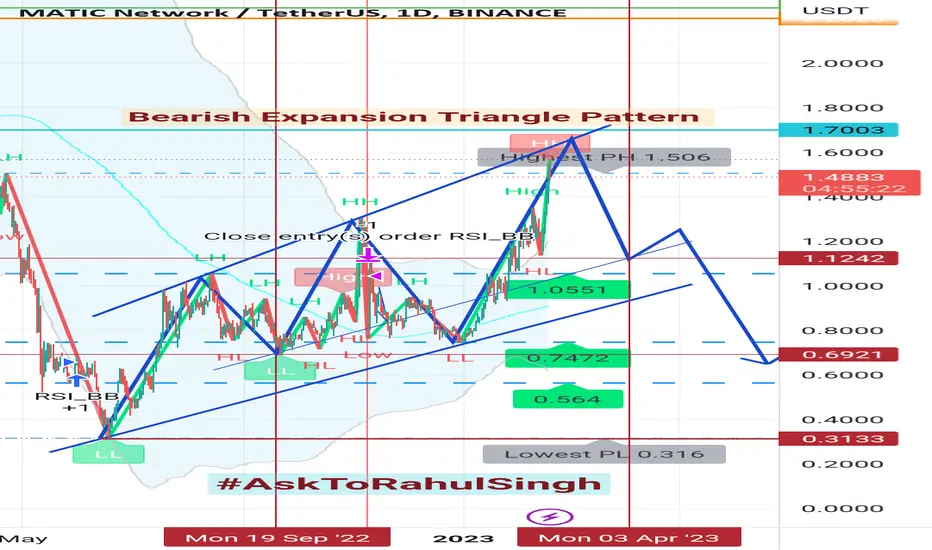
MATIC/USDT 1 DAY Chart
As per present #MATIC Technical Chart Analysis, based on Bearish Expansion Triangle Pattern, its 3rd final wave nearly completed today now and it's downside last wave will be starts. It's coming next target will be $1.13 and after next #BearishZone starts, next Lower-Low target is $0.69 upto April 2023.
As per present #MATIC Technical Chart Analysis, based on Bearish Expansion Triangle Pattern, its 3rd final wave nearly completed today now and it's downside last wave will be starts. It's coming next target will be $1.13 and after next #BearishZone starts, next Lower-Low target is $0.69 upto April 2023.

Publications connexes
Clause de non-responsabilité
Les informations et publications ne sont pas destinées à être, et ne constituent pas, des conseils ou recommandations financiers, d'investissement, de trading ou autres fournis ou approuvés par TradingView. Pour en savoir plus, consultez les Conditions d'utilisation.
Publications connexes
Clause de non-responsabilité
Les informations et publications ne sont pas destinées à être, et ne constituent pas, des conseils ou recommandations financiers, d'investissement, de trading ou autres fournis ou approuvés par TradingView. Pour en savoir plus, consultez les Conditions d'utilisation.