Short
MATICUSD ❕ downtrend
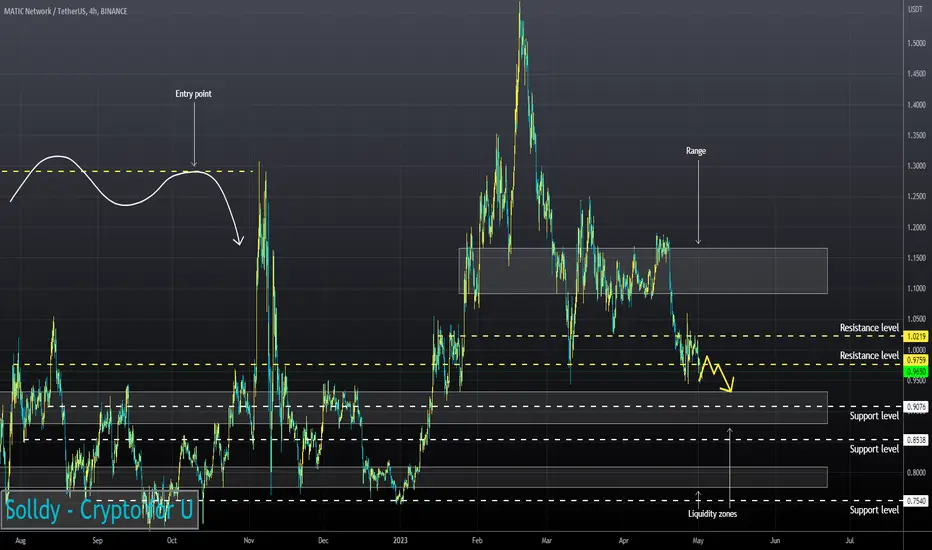
The movement of the RSI chart indicates that the asset continues its movement in a bearish trend and is now testing its upper limit (4H, 1H and 30m TFs)
I believe that the price of the asset will continue to decline if it fixes under the resistance level.
I believe that the price of the asset will continue to decline if it fixes under the resistance level.

Clause de non-responsabilité
Les informations et publications ne sont pas destinées à être, et ne constituent pas, des conseils ou recommandations financiers, d'investissement, de trading ou autres fournis ou approuvés par TradingView. Pour en savoir plus, consultez les Conditions d'utilisation.
Clause de non-responsabilité
Les informations et publications ne sont pas destinées à être, et ne constituent pas, des conseils ou recommandations financiers, d'investissement, de trading ou autres fournis ou approuvés par TradingView. Pour en savoir plus, consultez les Conditions d'utilisation.