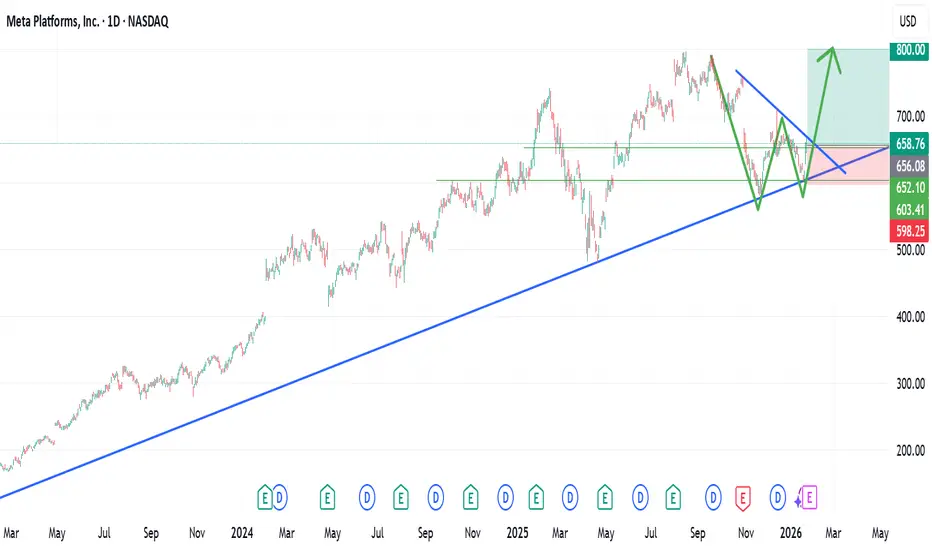
Meta Platforms ( META) continues to exhibit a resilient bullish structure on the daily timeframe.
Following a significant move identified in late 2025, the price has undergone a standard period of consolidation and healthy pullbacks, which is common for mega-cap technology stocks.
Technical Observations:
I am currently observing a clear W-pattern formation (double bottom) developing on the chart. This structure is often a reliable signal of a bullish reversal or trend continuation.
Furthermore, the price has successfully returned to retest an established support zone (the ascending trendline), which may have provided the necessary liquidity for a move toward higher targets.
The confluence of the retest and the pattern formation suggests that the previous bullish momentum remains intact, provided the current support levels are defended by buyers.
Potential Levels of Interest:
Entry Consideration: Near the $658 area.
Invalidation Level (Stop Loss): Below $596.
Upside Objective: Targeting the $800 psychological level.
Risk Disclosure and Conduct:
Trading involves significant risk. This analysis represents a personal technical perspective and is provided for educational and informational purposes only. It does not constitute investment advice, financial planning, or an inducement to buy or sell any security.
Individual traders should conduct their own thorough research and ensure any positions align with their personal risk tolerance and broader strategy.
What are your thoughts on the current price action for META? Does the current macro environment support a breakout, or do you see a different structural development? Feel free to share your technical perspective in the comments.
Look at the previous analysis: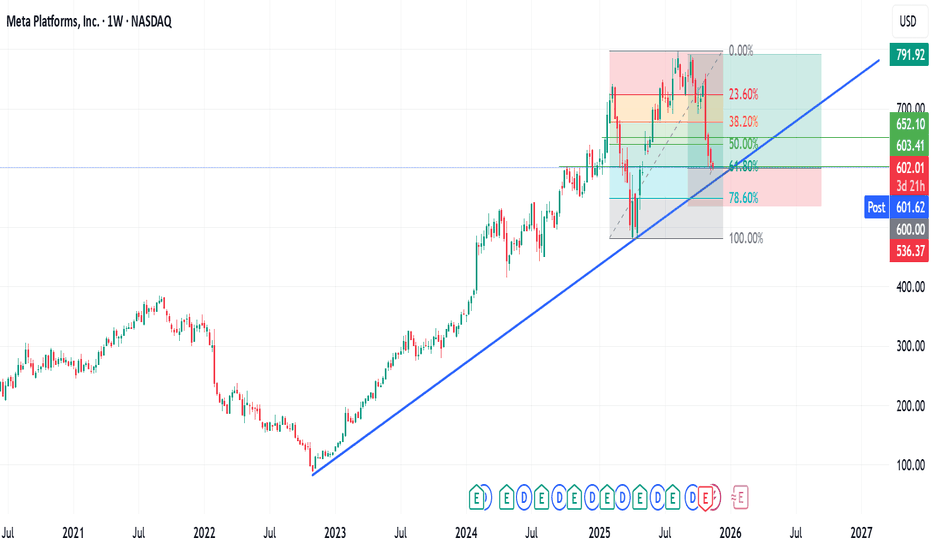
META) continues to exhibit a resilient bullish structure on the daily timeframe. Following a significant move identified in late 2025, the price has undergone a standard period of consolidation and healthy pullbacks, which is common for mega-cap technology stocks.
Technical Observations:
I am currently observing a clear W-pattern formation (double bottom) developing on the chart. This structure is often a reliable signal of a bullish reversal or trend continuation.
Furthermore, the price has successfully returned to retest an established support zone (the ascending trendline), which may have provided the necessary liquidity for a move toward higher targets.
The confluence of the retest and the pattern formation suggests that the previous bullish momentum remains intact, provided the current support levels are defended by buyers.
Potential Levels of Interest:
Entry Consideration: Near the $658 area.
Invalidation Level (Stop Loss): Below $596.
Upside Objective: Targeting the $800 psychological level.
Risk Disclosure and Conduct:
Trading involves significant risk. This analysis represents a personal technical perspective and is provided for educational and informational purposes only. It does not constitute investment advice, financial planning, or an inducement to buy or sell any security.
Individual traders should conduct their own thorough research and ensure any positions align with their personal risk tolerance and broader strategy.
What are your thoughts on the current price action for META? Does the current macro environment support a breakout, or do you see a different structural development? Feel free to share your technical perspective in the comments.
Look at the previous analysis:
Note
Congratulations.META at over $720

Publications connexes
Clause de non-responsabilité
Les informations et publications ne sont pas destinées à être, et ne constituent pas, des conseils ou recommandations financiers, d'investissement, de trading ou autres fournis ou approuvés par TradingView. Pour en savoir plus, consultez les Conditions d'utilisation.