
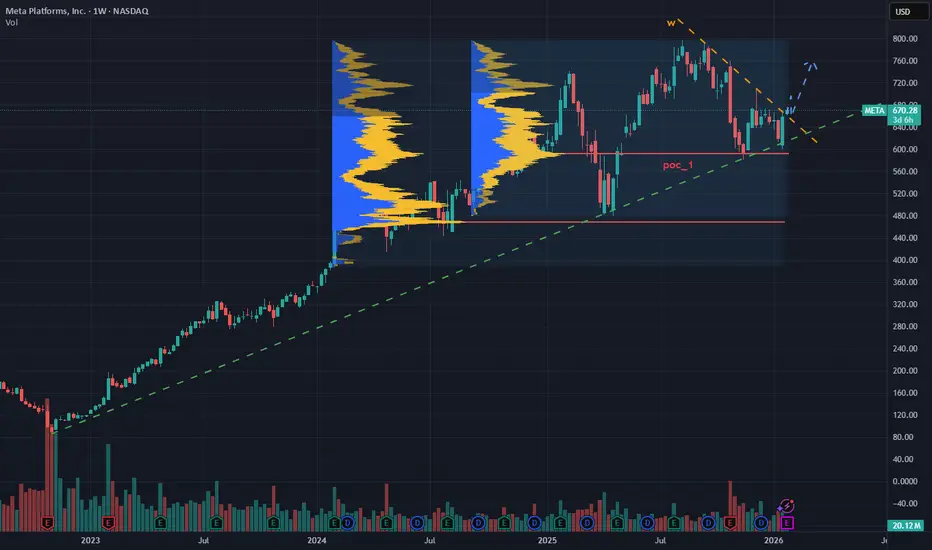
Meta Platforms needs little introduction. The company continues to show strong long-term growth and has been one of the best-performing stocks in the market over the past few years.
The stock comes from a major bullish phase that started in 2023, during which it gained over +600%, with healthy pullbacks occurring within the dominant uptrend.

Market Structure & Volume Analysis
Over the past few months, the stock has entered a retracement phase, which remains technically well-controlled.
Key points:

Bullish Scenario
For a bullish continuation scenario, price needs to:
A successful retest would strengthen the probability of trend continuation in line with the primary bullish trend.

⚠️ Trading Note
As long as price holds above POC_1 and the ascending weekly trendline, the broader bullish bias remains intact.
Failure to decisively break the descending weekly trendline would keep the stock in a consolidation/correction phase.
The stock comes from a major bullish phase that started in 2023, during which it gained over +600%, with healthy pullbacks occurring within the dominant uptrend.
Market Structure & Volume Analysis
Over the past few months, the stock has entered a retracement phase, which remains technically well-controlled.
Key points:
- the correction was contained at the first Point of Control (POC_1), calculated using volume from the top distribution area
- price reacted both at POC_1 and at the ascending weekly trendline
- two strong bullish reactions occurred in this confluence area (yellow circles), confirming it as a key support zone
Bullish Scenario
For a bullish continuation scenario, price needs to:
- break above the descending weekly trendline, which is currently being challenged
- ideally confirm the breakout with a pullback (retest), turning the trendline into dynamic support
A successful retest would strengthen the probability of trend continuation in line with the primary bullish trend.
⚠️ Trading Note
As long as price holds above POC_1 and the ascending weekly trendline, the broader bullish bias remains intact.
Failure to decisively break the descending weekly trendline would keep the stock in a consolidation/correction phase.

Clause de non-responsabilité
Les informations et publications ne sont pas destinées à être, et ne constituent pas, des conseils ou recommandations financiers, d'investissement, de trading ou autres fournis ou approuvés par TradingView. Pour en savoir plus, consultez les Conditions d'utilisation.
Clause de non-responsabilité
Les informations et publications ne sont pas destinées à être, et ne constituent pas, des conseils ou recommandations financiers, d'investissement, de trading ou autres fournis ou approuvés par TradingView. Pour en savoir plus, consultez les Conditions d'utilisation.