
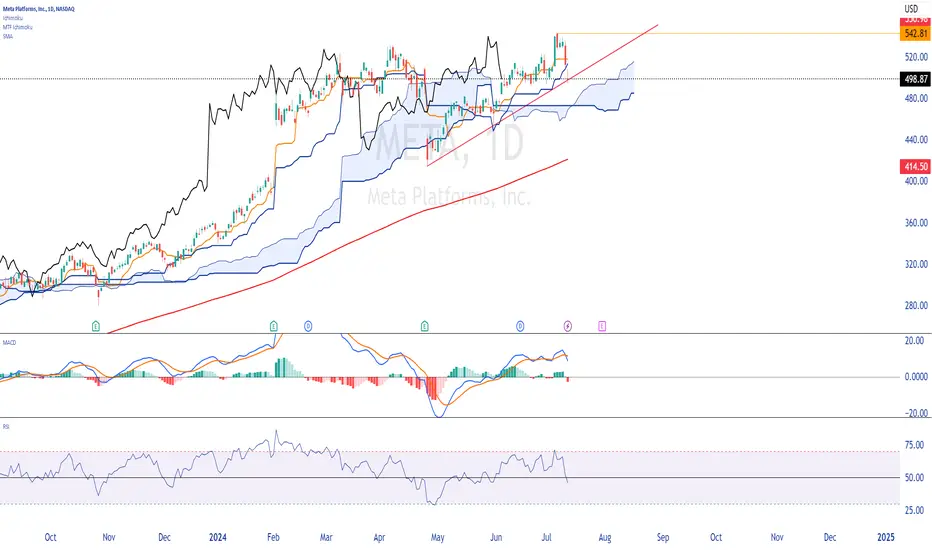
Daily chart with ichimoku.
Price under the tankan and under the kinjun.
We are above the cloud. Be careful, the cloud is thin and prices could pass through it easily.
The SMA 200 is under the cloud, so no worries.
MACD increasing, but above the 0 line.
The RSI is slightly below 50.
To conclude, the trend is bullish, we must monitor the break of my red line, which could announce a corrective movement.
Happy trading to you.
Price under the tankan and under the kinjun.
We are above the cloud. Be careful, the cloud is thin and prices could pass through it easily.
The SMA 200 is under the cloud, so no worries.
MACD increasing, but above the 0 line.
The RSI is slightly below 50.
To conclude, the trend is bullish, we must monitor the break of my red line, which could announce a corrective movement.
Happy trading to you.

Clause de non-responsabilité
Les informations et publications ne sont pas destinées à être, et ne constituent pas, des conseils ou recommandations financiers, d'investissement, de trading ou autres fournis ou approuvés par TradingView. Pour en savoir plus, consultez les Conditions d'utilisation.
Clause de non-responsabilité
Les informations et publications ne sont pas destinées à être, et ne constituent pas, des conseils ou recommandations financiers, d'investissement, de trading ou autres fournis ou approuvés par TradingView. Pour en savoir plus, consultez les Conditions d'utilisation.