
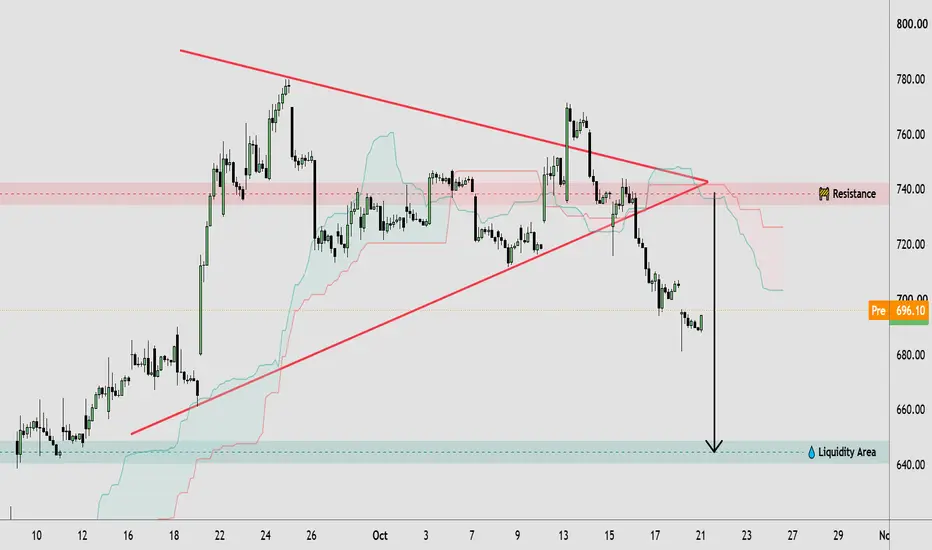
🔹 META has broken below the rising support trendline of its previous symmetrical triangle, suggesting a bearish shift in short-term market structure. After several rejections near the 740–750 resistance zone, price lost its ascending support and moved lower, forming a sequence of bearish candles and weaker price levels. The current price action near 695 indicates continued selling pressure, while the highlighted liquidity area around 640–650 represents a potential downside zone to watch. This breakdown suggests that buyers are struggling to regain control unless price recovers above the broken trendline and key resistance.
🔸 From a technical analysis perspective, META could continue toward the lower liquidity zone if bearish momentum persists and the breakdown remains confirmed. However, a recovery above the broken support and a sustained move back toward resistance could indicate a potential bullish recovery or a false breakout. Traders may wait for price confirmation and a clear market-structure shift before considering any trade. If the current bearish structure holds, downside liquidity may remain in focus; if resistance is reclaimed, the bearish outlook could weaken.
This analysis is for educational purposes only and does not constitute financial or investment advice. Always conduct your own research before making trading decisions.
Transaction en cours
Trade fermée: cible de profit atteinte

📲 Join Our Telegram Community
t.me/+rSX57G_rhcFlMTA0
t.me/+rSX57G_rhcFlMTA0
Publications connexes
Clause de non-responsabilité
Les informations et publications ne sont pas destinées à être, et ne constituent pas, des conseils ou recommandations financiers, d'investissement, de trading ou autres fournis ou approuvés par TradingView. Pour en savoir plus, consultez les Conditions d'utilisation.