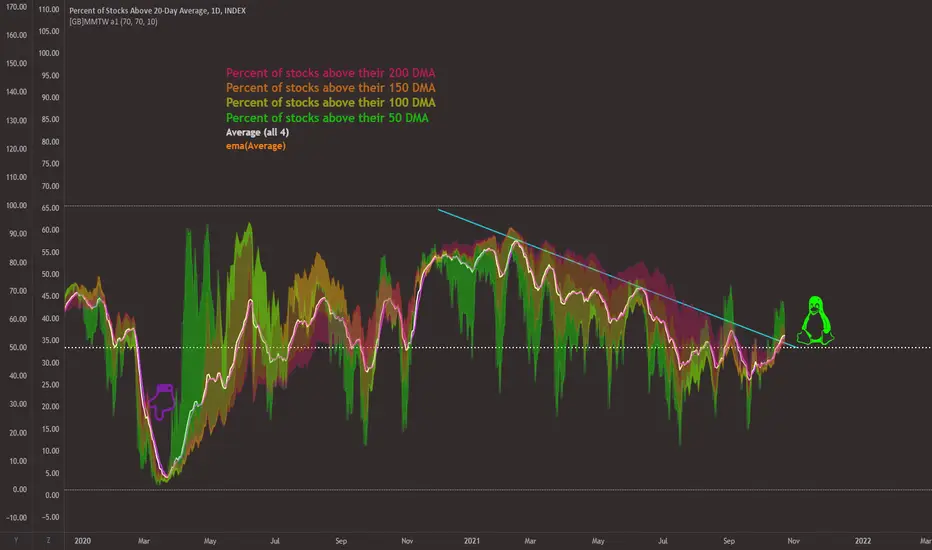
The daily chart is showing market sentiment from a breadth perspective: the percentage of stocks on the NYSE (2943 stocks) that are above their daily moving averages.
The trend is increasingly bullish but that increase has peaked in recent days.
[bDetail:
Average of all 4 - WHITE line
EMA10 of the white line - ORANGE line
All 4 indicators and their mean are above the midline with positive momentum .
That momentum has peaked in recent days and is no longer accelerating.
The trend is increasingly bullish but that increase has peaked in recent days.
[bDetail:
- MMTH - RED - Percentage of stocks above their 200 DMA
MMOF - Percentage of stocks above their 150 DMA
MMOH - Percentage of stocks above their 100 DMA
MMFI - GREEN - Percentage of stocks above their 50 DMA
Average of all 4 - WHITE line
EMA10 of the white line - ORANGE line
All 4 indicators and their mean are above the midline with positive momentum .
That momentum has peaked in recent days and is no longer accelerating.

Clause de non-responsabilité
Les informations et publications ne sont pas destinées à être, et ne constituent pas, des conseils ou recommandations financiers, d'investissement, de trading ou autres fournis ou approuvés par TradingView. Pour en savoir plus, consultez les Conditions d'utilisation.
Clause de non-responsabilité
Les informations et publications ne sont pas destinées à être, et ne constituent pas, des conseils ou recommandations financiers, d'investissement, de trading ou autres fournis ou approuvés par TradingView. Pour en savoir plus, consultez les Conditions d'utilisation.